Experiments in Yandex.Direct allow you to statistically compare any ad settings, including bid management strategies, campaign types, and even proposals from different advertising agencies. To put it simply, experiments are A/B tests with broader capabilities.
Previously, this tool was available by request to advertisers adept with analytics. Now, with this new Yandex.Metrica report, advertisers can run tests even if they don’t have special skills, and businesses of any size can run experiments. It is now easy to draw conclusions: the system will automatically check whether enough data has accumulated for analysis. More positive values will be highlighted green, and less positive ones in red. Before we get ahead of ourselves, let’s look at things in order.
How it works
First, launch an experiment. You can use experiments, for example, to:
- choose the most effective bid management strategy
- compare placements on search and in ad networks
- test different types of campaigns or any of their settings, e.g. try out video ads to see if it's a productive format.
When starting an experiment, it is important to keep several things in mind:
- Test one hypothesis at a time.
- Ideally, an experiment should have at least 200 conversions for a statistically significant result. If you have less data, it's wiser to investigate a goal higher up on the sales funnel that occurs more often.
- If you are looking to compare the performance of manual and automatic strategies, it is important that campaigns spend the same amount of money during the experiment.
A detailed guide is available in the Help sections of Yandex.Audience and Yandex.Direct.
How to assess the results
The new report will appear in the Yandex.Metrica interface in the section "Sources → Yandex.Direct" right after you create the experiment. To assess the statistics for the experiment, switch the report to comparison mode:

It usually takes about two weeks to gather enough statistics. If the data is insufficient, it will be impossible to make a clear conclusion about which of the options was better. Just like with coin tosses: if the result was "heads" two out of ten times, it does not mean that "tails" is always the rarer option.
How to determine if you have sufficient data
To figure out if you have enough data to make a comparison, you should assess their statistical significance. In other words, you should make sure that the current result will not differ significantly from the results of endless coin tosses.
You don't need to calculate anything manually — Yandex.Metrica automatically determines the statistical significance of the experiment.
You have enough data if the indicators you decide to use to assess your experiment are highlighted:
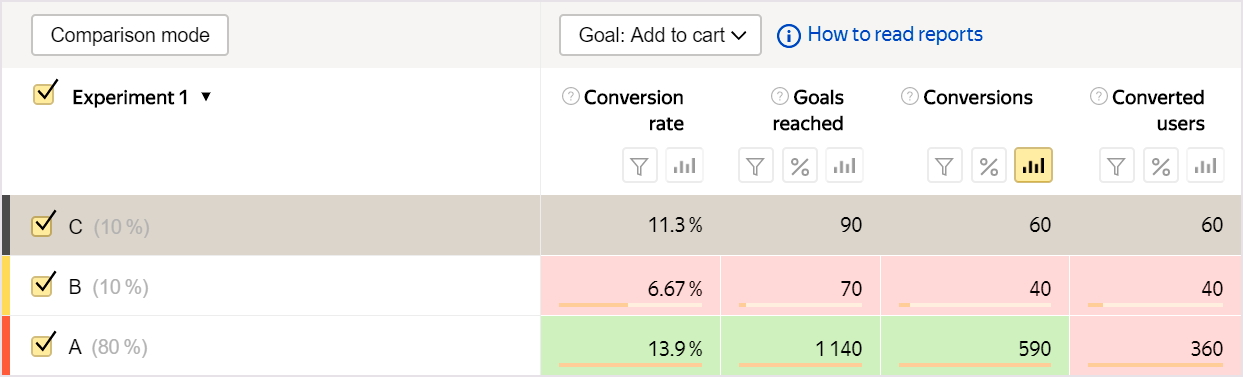
- Green means that the experimental option showed far better results than the control.
- Red means the experimental option performed significantly worse.
- Grey means that there is sufficient data, but the indicators of the control and experimental options do not differ significantly.
An indicator not being highlighted can mean one of two things:
- Insufficient data. You need to wait a bit longer or launch a new experiment with different settings that will allow you to gather more traffic.
- Comparison is unavailable for this indicator. You can view the list of indicators available for comparison in the Yandex.Metrica help.
Use the A/B Testing Reliability Calculator along with the Yandex.Metrica report
The Yandex.Metrica report quickly answers the question of whether you have enough data to make an assessment, while also allowing you to compare the conversion metrics of your control and experimental campaigns. For example, if you test different versions of your landing pages, the Yandex.Metrica report will show which of them has higher conversion rates. Conversion comparisons will be helpful if you are checking different audience targeting types: let's say that you want to know who responds better to your content — men or women.
If you want to experiment to determine which option will show better CPA, our new A/B Testing Reliability Calculator can be of help. Let's say that you are comparing different bid adjustments. You can enter your spend, number of conversions and clicks for each of the variants into the Calculator, and the system will check whether there is enough data and show which is the better variant. For example, if you compare different amounts of bid adjustments, you can manually enter expenses for each option, the number of conversions and clicks in the calculator — the system will calculate the CPA itself, check whether there is enough data, and show a more profitable option.
We put together a checklist to help you get your first experiment up and running:
For more details about the Yandex.Metrica report for experiments in Yandex.Direct, please visit the Yandex.Metrica Help section. If you still have questions, please contact the customer service department. We will be glad to help!


