
Time zones now available for all reports
Each report can now have its own time zone, which is saved along with the report. The first time you switch to a new report, the time zone set in Yandex ID is selected automatically. However, you can edit it manually.
Reports created before the new feature was introduced will default to the UTC+3 time zone.
New features for chart visualization
Each grouping in Statistics now has its own color that remains consistent when switching If you simultaneously select multiple metrics and groupings on a chart, the metrics within one grouping will have different color shades in a bar chart and different line types in a line chart.

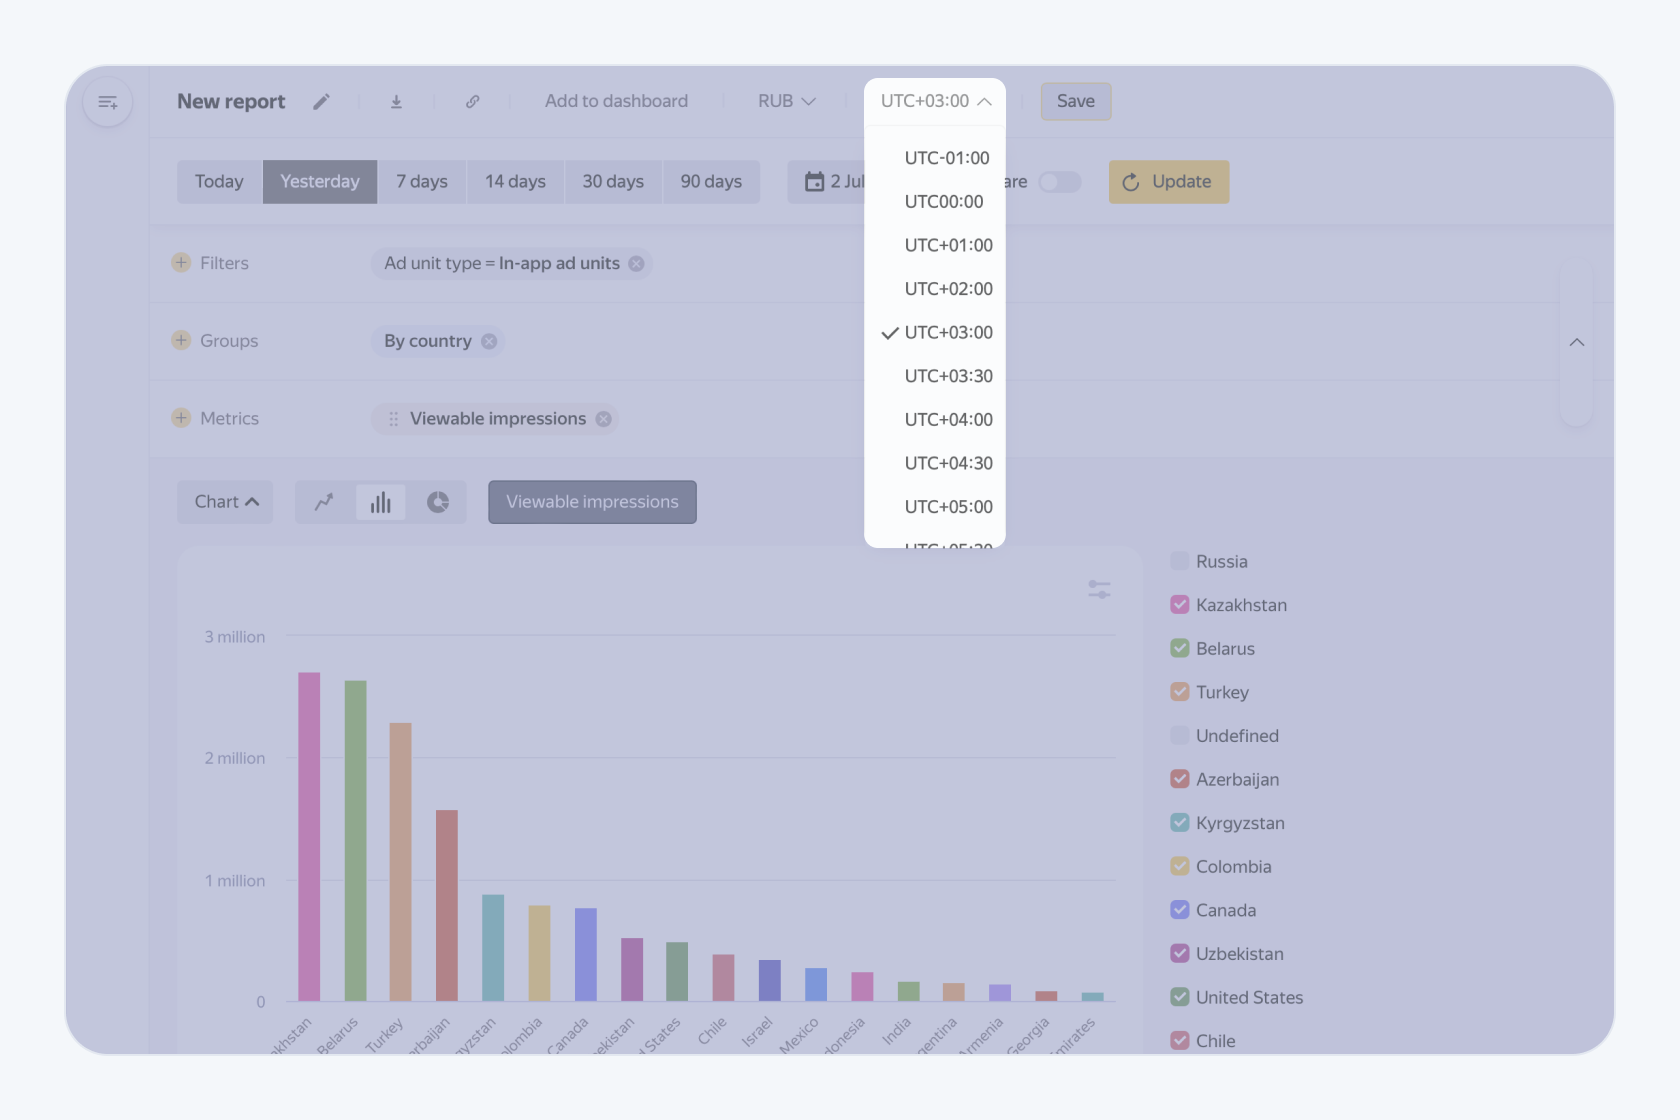
Example of the new grouping design for a bar chart

Example of the new grouping design for a line chart
In addition, the Y-axis on charts will display the actual ratio of values.
To learn more about the Report Builder features, see Help.


