Remarketing
The Remarketing report contains information about remarketing campaigns that are launched to return an audience to your app. There is a special tracker type for remarketing campaigns. For more information, see Creating a remarketing tracker
The report displays data about the users that returned to the app (re-engagement), as well as target events they have completed. AppMetrica counts re-engagements when a user runs the application after clicking on the tracking URL or re-engagement deeplink.
The report allows you to pull out certain users by defining data segments. You can apply only user level segmentation filters for the report.
Report period
The report is formed for a specific time period. The default period is one week.
To set the report period, use the drop-down element  . The selected time interval can be grouped by hours, days, weeks, or months.
Grouping data
- Media source.
- Tracker.
- Tracking URL parameters.
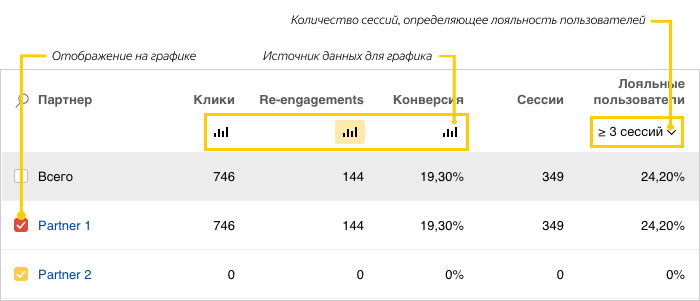
To view the list of partner trackers, click on the partner's name in the report (when the data is grouped by media source). When the data is grouped by tracker, you can view the list of all the tracker parameters by clicking the tracker's name.
Metrics
The following metrics are available for analysis:
- Advertising metrics
-
- Clicks.
The number of clicks that users made on the tracking link or re-engagement deeplink.
- Installations
-
- Re-engagements.
The total number of re-engagements. AppMetrica counts re-engagements when a user runs the application after clicking on the tracking URL or re-engagement deeplink.
- Conversion rate.
The click-to-re-engagement conversion rate.
- Usage
-
- Sessions.
The number of user sessions for the entire time since re-engagement.
- Loyal users.
The percentage of the total number of users who have a certain number of sessions. You can set the number of sessions.
- Total Revenue
-
- Total Revenue.
Total revenue from advertising monetization, in-app purchases, and in-app subscriptions for the reporting period. Learn more about converting currencies.
- Total ARPU.
The ratio of the total app revenue from advertising monetization, in-app purchases, and subscriptions for the reporting period to the number of app users for the same period. Learn more about converting currencies.
- In-App Revenue
-
- Purchases.
The number of in-app purchases and subscription events with positive revenue.
- In-App Revenue.
Total revenue from in-app purchases and in-app subscriptions. Learn more about converting currencies.
- Average order.
The ratio of revenue from all in-app purchases and subscriptions to their number. Learn more about converting currencies.
- Paying users.
The number of users who made at least one in-app purchase or subscription during the selected period.
- Purchases per paying user.
The ratio of the number of in-app purchases and subscriptions to the number of paying users for the selected period.
- In-App ARPU.
Average revenue per user. Calculated as the ratio of the total revenue from in-app purchases and subscriptions to the total number of app users for the selected period. Learn more about converting currencies.
- In-App ARPPU.
The ratio of the total revenue from in-app purchases to the number of paying users for the selected period. Learn more about converting currencies.
- % of paying users.
The ratio of the number of users making in-app purchases or subscribing to all users for the selected period.
- Invalid revenue.
Total revenue from invalid in-app purchases and subscriptions for the selected period. Invalid in-app purchases aren't counted in other Revenue metrics.
- Users with invalid revenue.
The number of users with invalid in-app purchases and subscriptions over the selected period. Invalid in-app purchases aren't counted in other Revenue metrics.
- Ad Revenue
-
- Ad Revenue events.
The number of events with advertising revenue (Ad Revenue) for the selected period.
- Ad Revenue.
Total revenue from advertising monetization for the selected period.
- Ad ARPU.
The ratio of app revenue from advertising monetization for the selected period to the number of app users for the same period. Learn more about converting currencies.
- eCPM.
The ratio of the total revenue from advertising monetization to the number of events with Ad Revenue for the selected period multiplied by 1000.
- Users with Ad Revenue.
The number of users with Ad Revenue events for the selected period.
- Ad Revenue events per user.
The ratio of the number of events with Ad Revenue to the number of users for the selected period.
- Sessions with Ad Revenue.
The number of sessions during which events with Ad Revenue were committed for the selected period.
- Ad Revenue events per session.
The ratio of the number of events with Ad Revenue to the total number of sessions for the selected period.
- % of users with Ad Revenue.
The ratio of the number of users with Ad Revenue events to all users for the selected period.
The report interface also displays the following:
- The color key of metrics on the chart. Use it to show or hide a metric on the chart.
- The traffic source selection for the chart. Enables you to choose which metric to show on the chart: clicks, re-engagements, or conversion.
Events
You can add up to 5 events to the report to monitor the information about an event in the context of the traffic source.
The following metrics are available for the specified event:
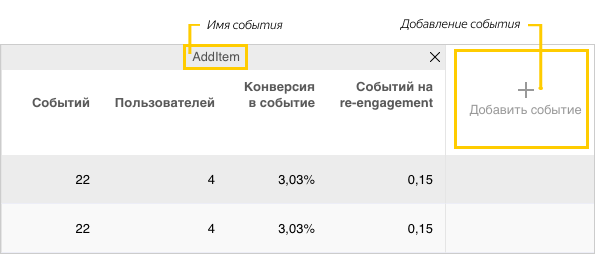
- Events count
- The total number of events that occurred in the application.
- Number of users
- The number of users who had this event occur in the application.
- Event conversion
- The percentage of users with the event out of the total number of users who returned to the app.
- Event per re-engagement
- The average number of events per re-engagement.
To show the event information, select it in the drop-down list. Sending an event should be configured when the SDK is initialized.
Data export
You can export data by choosing an item from the Export dropdown list above the chart. The data is exported based on the selected report settings: segmentation, grouping, and time period.
The dropdown list contains the following elements:
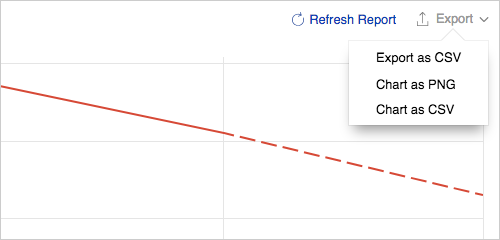
- Export as CSV — Exports the data from the table in the CSV format.
- Chart as PNG — Exports the chart image in the PNG format.
- Chart as CSV — Exports the data from the chart in the CSV format.