Engagement
The “Engagement” report displays information about how much time the user spends in the app on average, how often the app starts, the average session length, the total number of sessions, and the total time in the app.
The report allows you to pull out certain users by defining data segments.
The report will help you:
- Evaluate the time spent by users in the app
-
Use the Timespent per user metric to determine the average time that the user spent in the app, and the Total timespent metric for the total time (for example, users spent 100 thousand hours in your app in total).
- Determine the average duration of the session
-
Use the Average session length metric combined with various groupings by date, app version, or geography. You can also use the Session length grouping for visual distribution by intervals.
- Evaluate the frequency of app use
-
Use the Session per user metric combined with groupings by periods (day, week, month).
- Compare engagement rates of different user groups
-
Use groupings by platform, app version, geography, or a combination of them (for example, by week and app version).
Working with the report
General settings
Choose the time period and audience segment. By default, the report shows data for the week grouped by days.
The time in the report is the beginning of the session on the user's device in the time zone specified in the app settings.
Note.To set the report period, use the drop-down element
 . The selected time interval can be grouped by hours, days, weeks, or months.
- In the report, you can select specific users by using segmentation.
Configuring a chart with a choice of metrics
The report contains a visual chart with a choice of metrics. You can select no more than three metrics at a time. The selected metrics must have the same units. If a metric is not available in the list (its name is written in gray), it means that it has a different unit.
Selecting dimensions and metrics
The report contains metrics grouped into groupings.
To set up groupings and metrics:
- Click the
 button.
 - In the window that opens, add the groupings and metrics to base the report on.
Configure the order of metrics and groupings.
The order of metrics determines the order of columns, the order of groupings determines the nesting of rows in the table.
Groupings
- Session length. Grouped by intervals:
Undefined | 0-9 seconds | 10-29 seconds | 30-59 seconds | 1 minute | 2 minutes | 3 minutes | 4 minutes | 5-9 minutes | 10-19 minutes | 20-29 minutes | 30-59 minutes | 1 hour | 2-4 hours | 5-9 hours | more than 10 hours. - Operating system.
- OS version.
- Gender. Determined heuristically using Crypta technology. If the prediction accuracy is insufficient , it takes the
Undefinedvalue. - Age. Determined heuristically using Crypta technology. Possible values:
<18 | 18-24 | 25-34 | 35-44 | 45-54 | ≥55. If the prediction accuracy is insufficient, it isUndefined. - Continent.
- Country.
- District.
- Region.
- City.
- City size.
- Month.
- Week.
- Day.
- Version.
- Build number.
The Session length amount can take the Undefined value if this session was the only one. For more information, see A certain number of sessions have no defined duration.
Metrics
Data is calculated by user session. Background sessions (sessions in which the app runs in the background and the user doesn't interact with it directly) aren't taken into account.
- Sessions. Number of sessions.
- Timespent per user. The total duration of sessions divided by the number of users with 1+ session per period (sessions with an undefined duration aren't taken into account. For more information, see A certain number of sessions have no defined duration).
- Average session length. The total duration of sessions divided by their number (sessions with an undefined duration aren't taken into account).
- Session per user. The number of sessions divided by the number of users with 1+ session per period.
- Total timespent. The total duration of all sessions (sessions with undefined duration aren't taken into account; for more information, see A certain number of sessions have no defined duration).
Data export
You can export data by choosing an item from the Export dropdown list above the chart. The data is exported based on the selected report settings: segmentation, grouping, and time period.
The dropdown list contains the following elements:
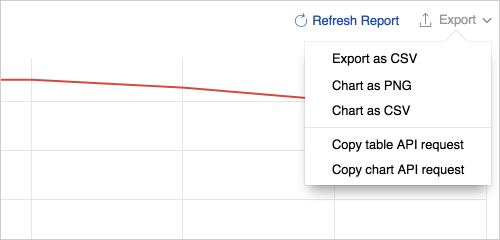
- Export as CSV — Exports the data from the table in the CSV format.
- Chart as PNG — Exports the chart image in the PNG format.
- Chart as CSV — Exports the data from the chart in the CSV format.
- Copy table API request — Displays the query text for exporting data from the table using the Reporting API. You can use this query to build your own dashboard or create automated data export scripts.Note. If you are getting the text of the query for the first time, make sure that the browser doesn't block the pop-up authorization window. In the authorization window, allow AppMetrica to access the data.
- Copy chart API request — Displays the query text for exporting data from the chart using the Reporting API. You can use this query to build your own dashboard or create automated data export scripts.Note. If you are getting the text of the query for the first time, make sure that the browser doesn't block the pop-up authorization window. In the authorization window, allow AppMetrica to access the data.
Troubleshooting
- A certain number of sessions have no defined duration
- Too many sessions with a duration of 0–9 seconds
A certain number of sessions have no defined duration
When using automatic session tracking (Android | iOS), AppMetrica receives information about the end of the session when the next app activity occurs, including in the background. Accordingly, the exact duration of the session can't be calculated if the app process was forcibly terminated by the user and no longer started.
Too many sessions with a duration of 0–9 seconds
User activity is tracked using the SDK (Android | iOS). When using automatic tracking, the default session timeout is 10 seconds. You can change this value using the library configuration settings (Android | iOS).