Charts
The new Report Wizard visualizes campaign metrics (impressions, clicks, CTR, expenses, conversions, and more) so you can easily see their dynamics in the charts.
Watch video
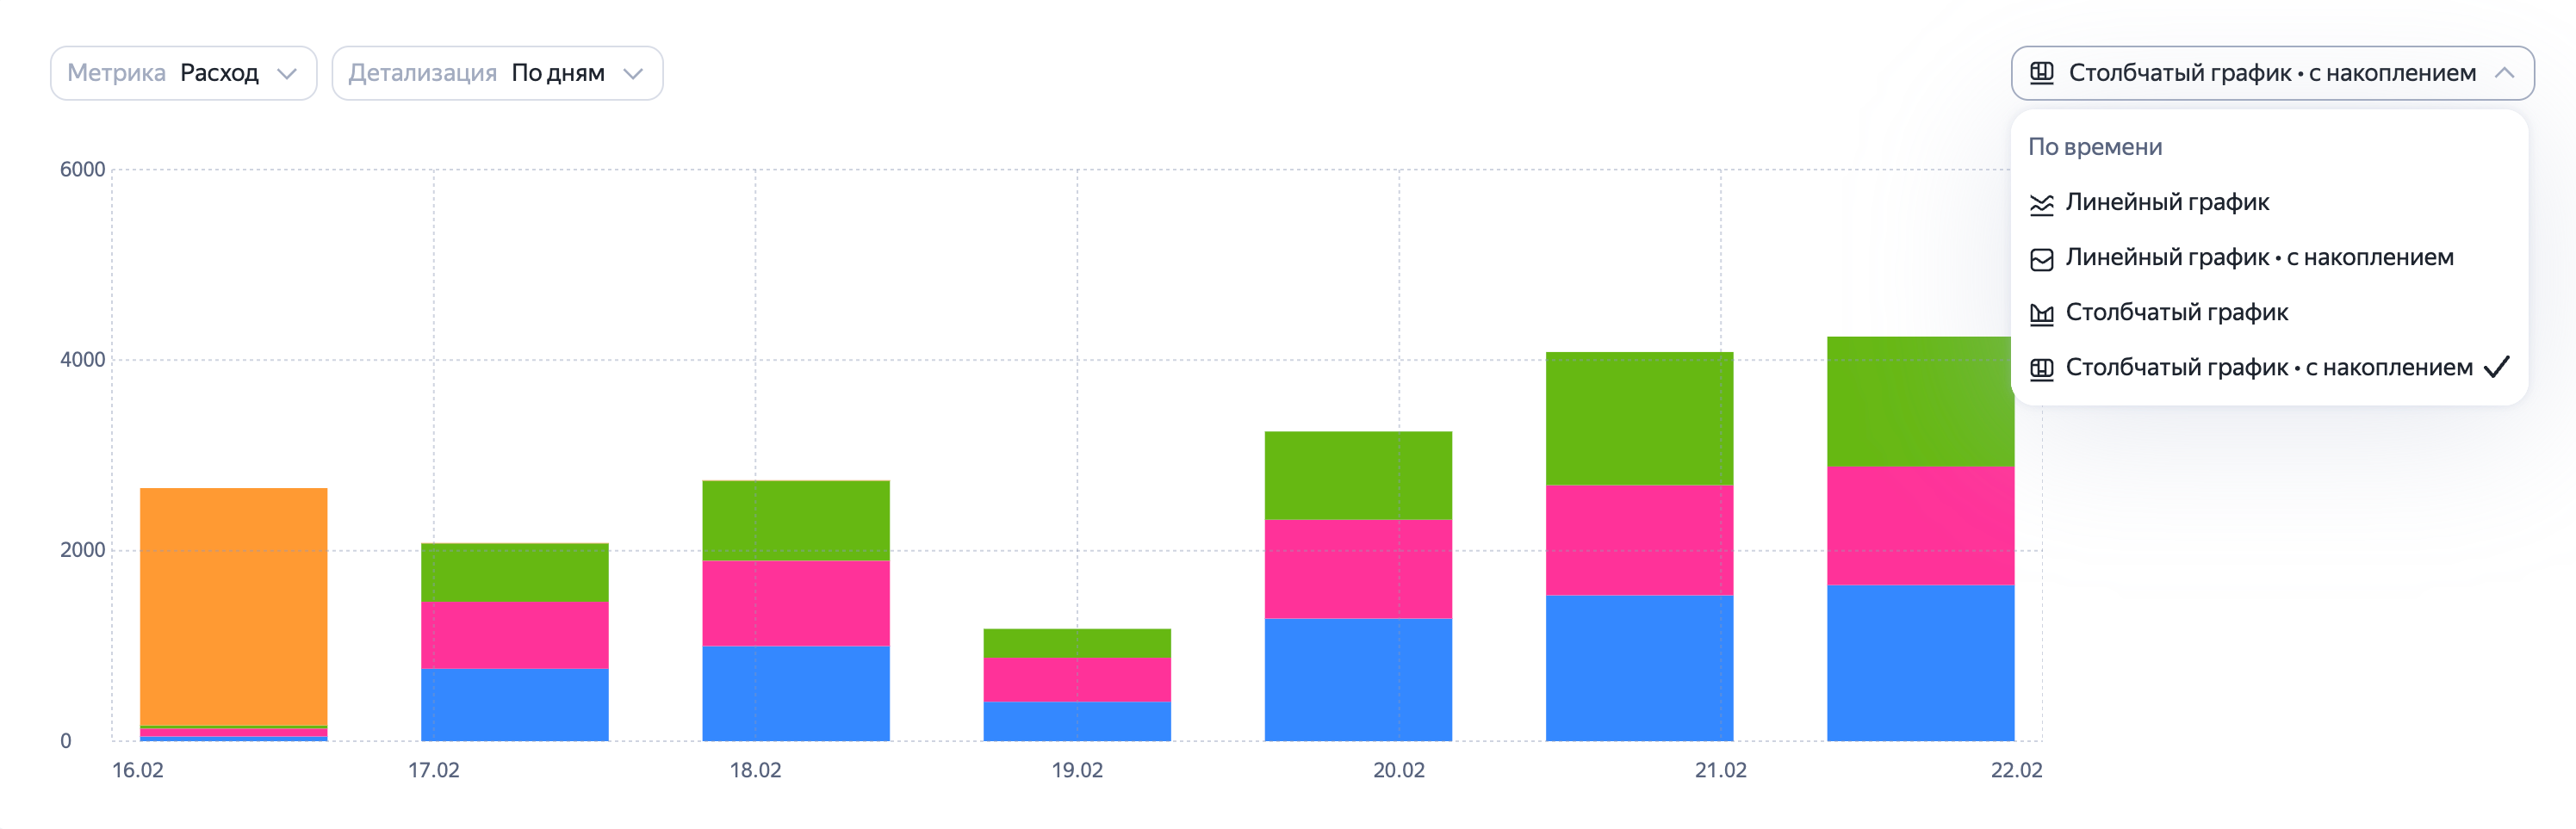
The following chart types are available:
- Line chart
- Line chart (stacked)
- Bar chart
- Bar chart (stacked)
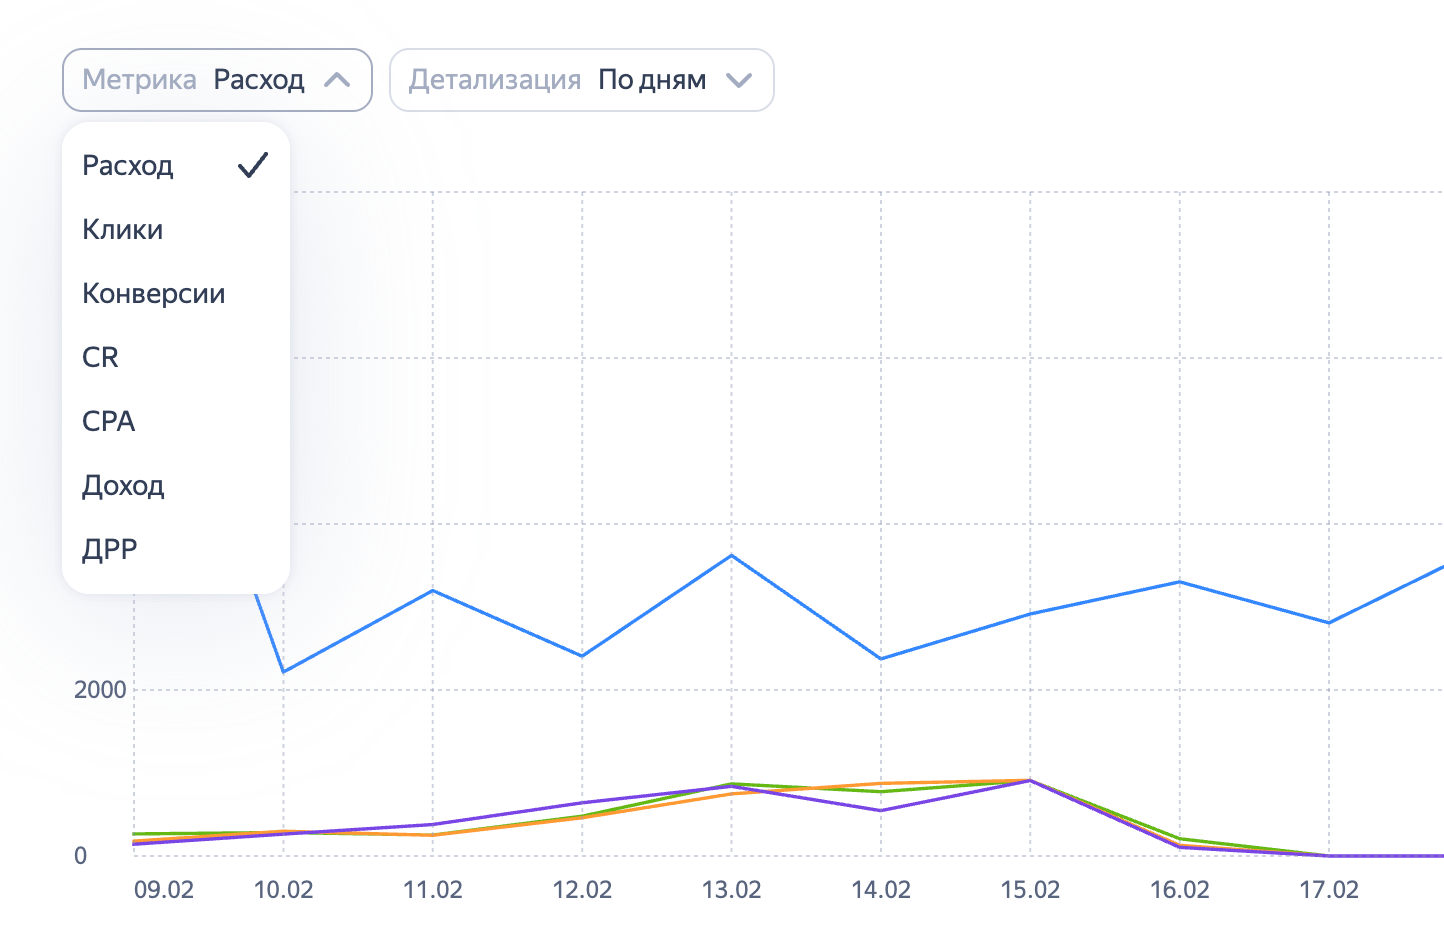
Choose which metrics to display in the chart — select them in the Metrics drop-down list. You can choose up to five metrics at once for line and bar charts.
For stacked charts, you can only select a single metric. It must be additive so the system can track the total value. For example, stacked charts are available for spending, clicks, and impressions, but not for CR, CTR, or CPA.
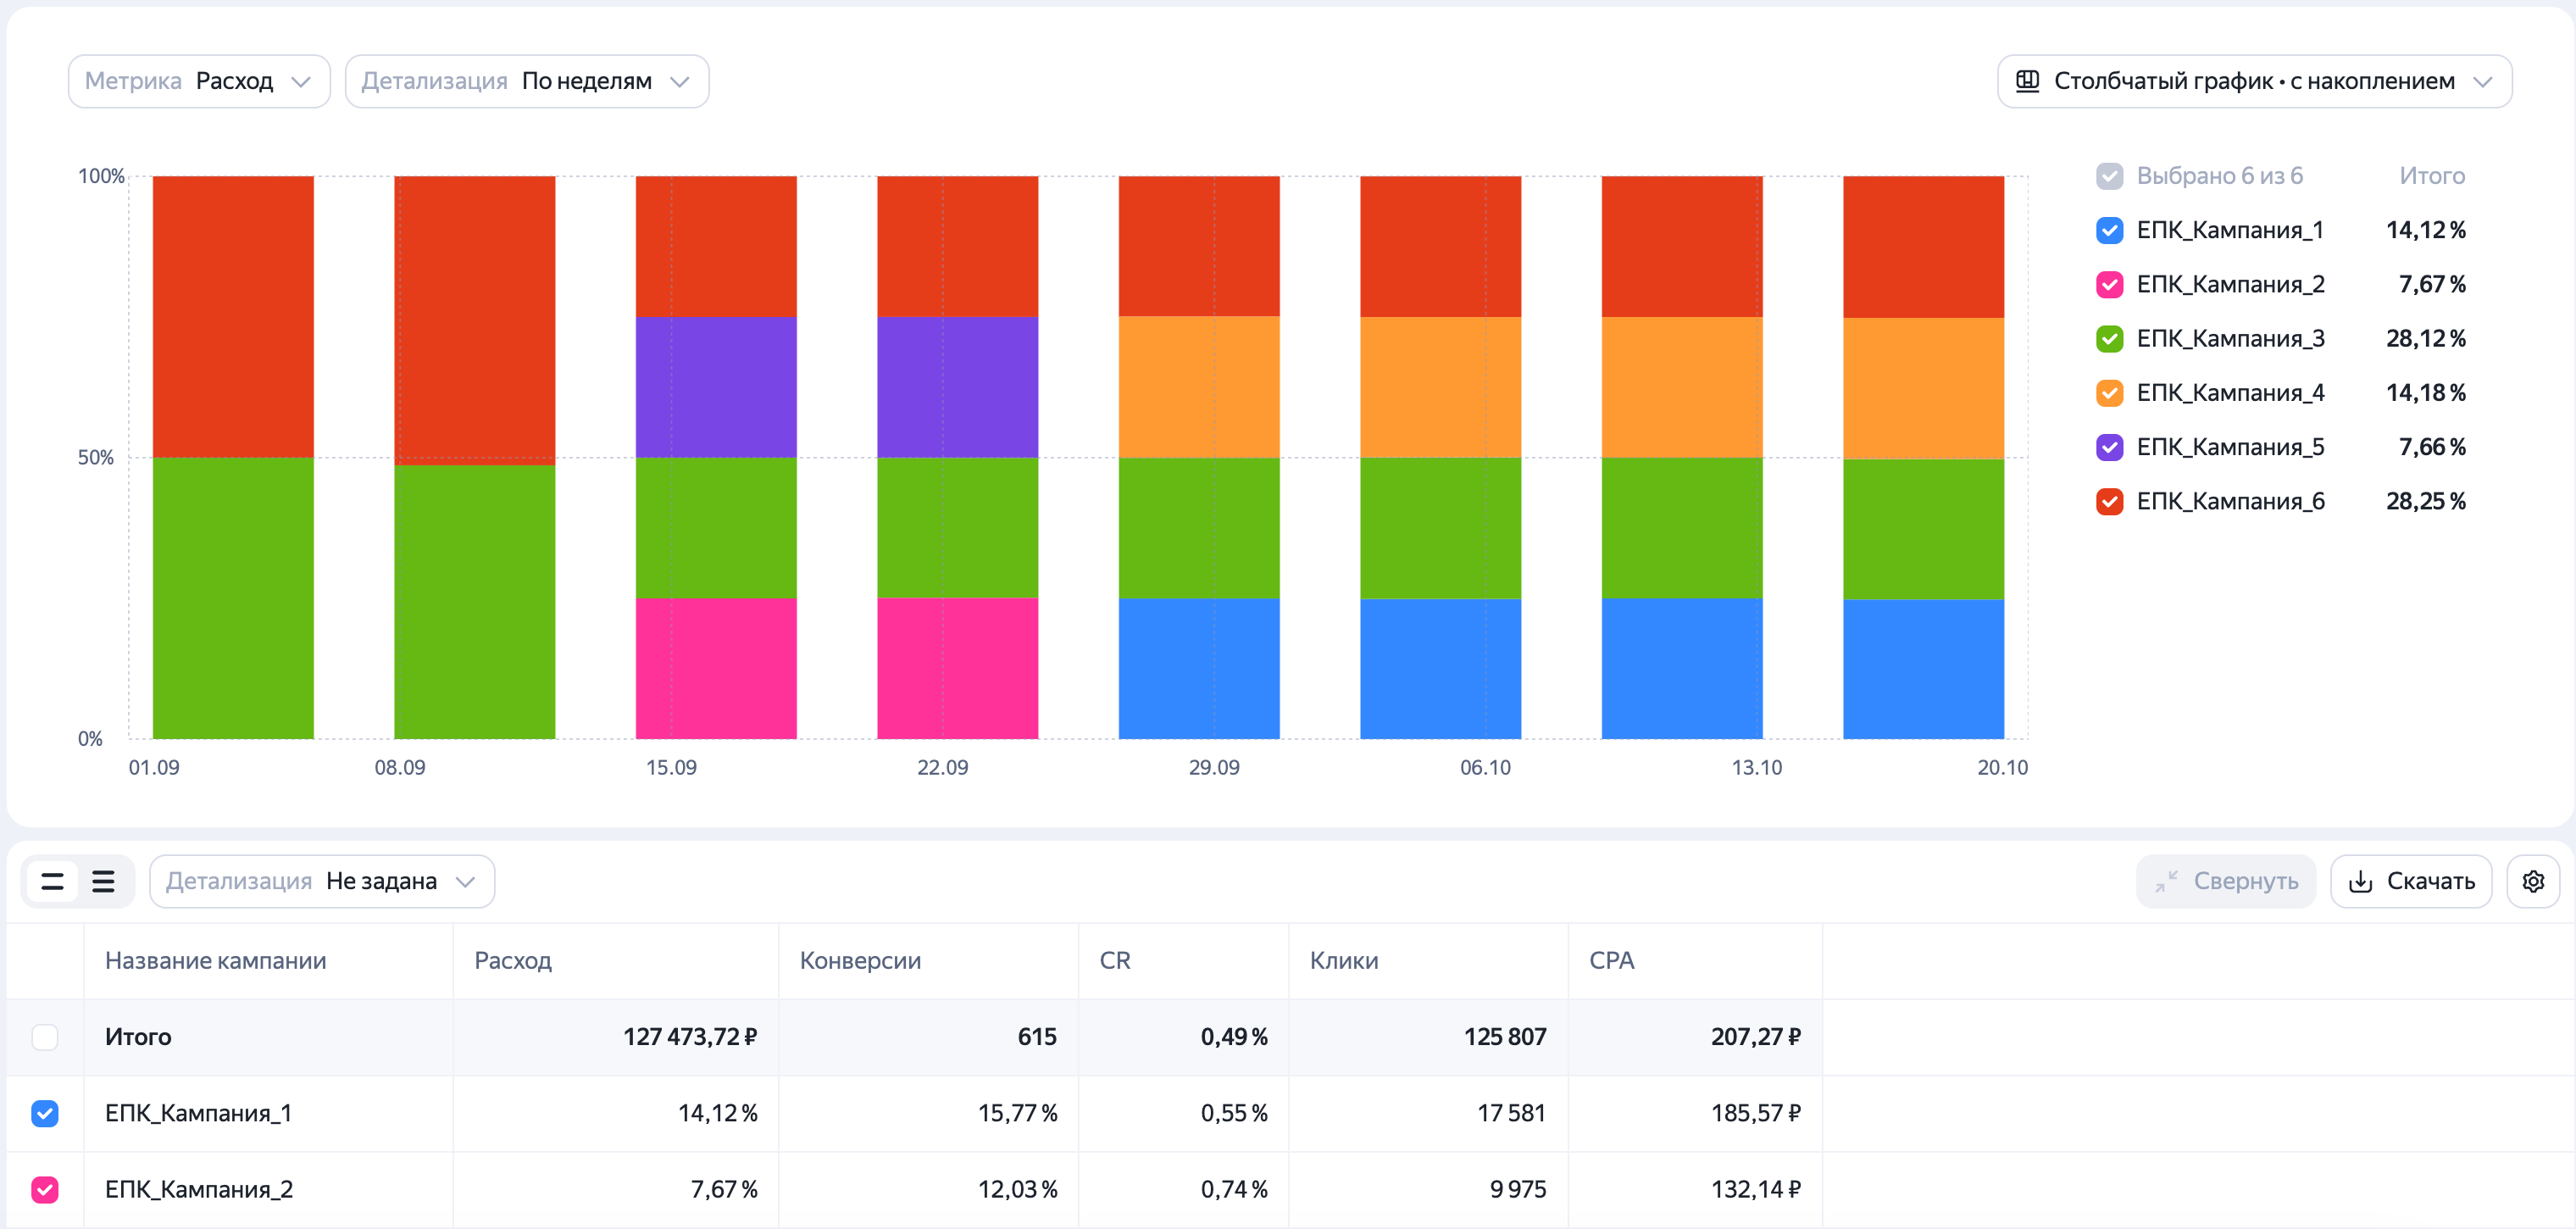
With stacked charts, you can not only view the total data, but also build a normalized chart showing the percentage distribution. To do this, change the display mode from absolute values to percentages in the metric's column settings.
The available metrics correspond to those added to the data table. If you want to show other metrics on the chart, add them to the report table using the Dimensions and metrics option.
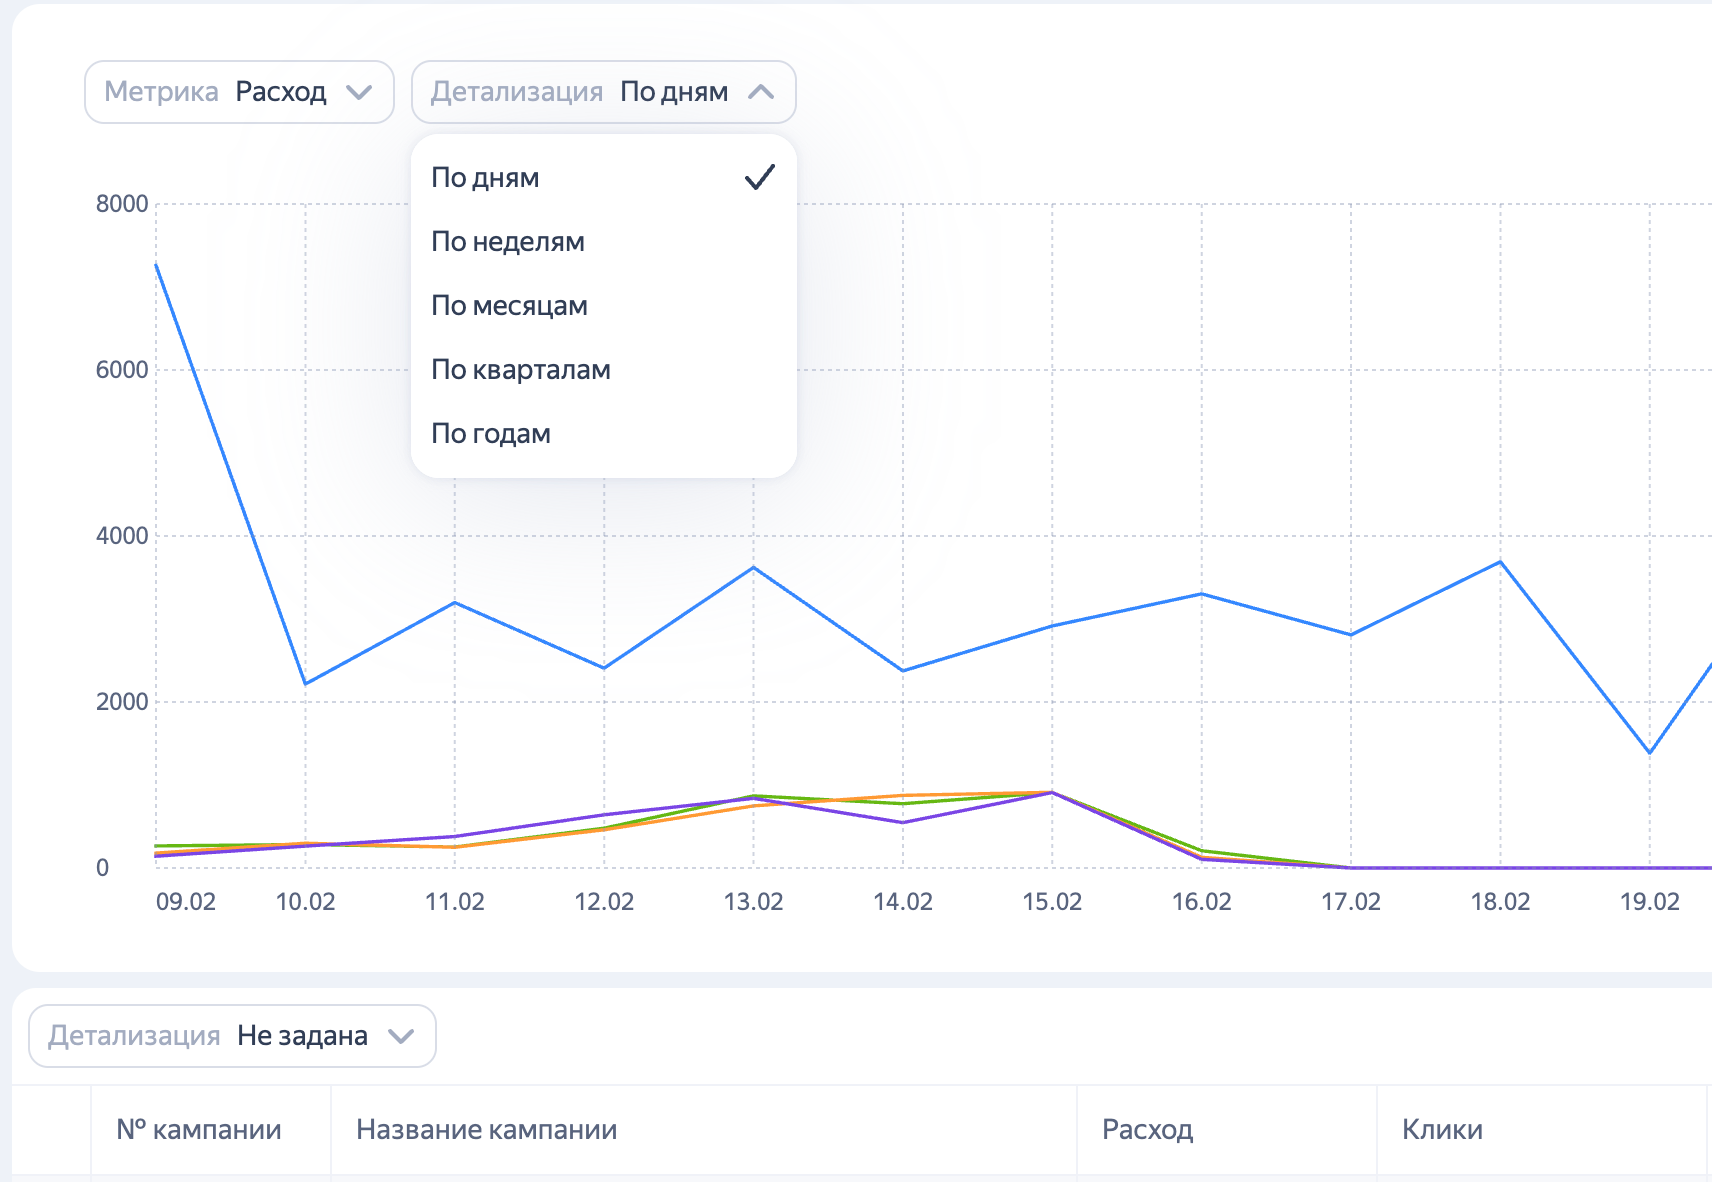
You can choose the level of detail in the settings above the chart. Your choice only affects the data display in the chart. Data breakdown in the report table remains unchanged.
You can control what data appears on the chart using checkboxes in the report table or the list to the right of the chart.
Watch video
Have questions?
Alert
Our customer support can only assist you with campaigns linked to the username you are contacting us from. You can check your username by opening ya.ru in another browser tab. Our team can access your data only when processing your request.
Scan the QR code or tap it to follow the link.


If you select Telegram or WhatsApp, keep in mind that Yandex does not control and is not liable for how third-party messengers store your data and chat history.