Campaign statistics
You can efficiently analyze the results of your campaign by checking the statistics directly on the campaign page. Here you can find information about impressions, clicks, conversions, cost of conversion, revenue, expenses, and cost revenue ratio. Statistics are available in several reports.
General statistics
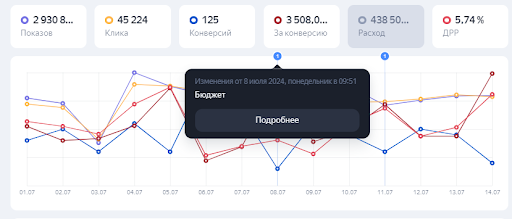
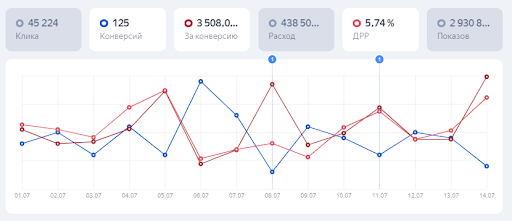
The chart shows how your metrics evolve over the course of your campaign and the effect of adjustments to its goal, budget, ads, and other parameters. Analyzing this chart can help you understand how various changes affected the campaign's results.
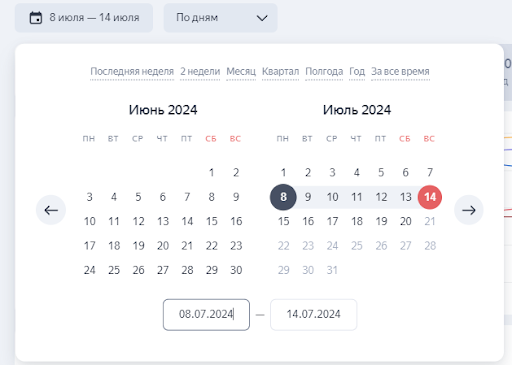
Use the calendar to select a date range you want to analyze. Campaigns are designed to achieve results in weekly timeframes, so it's best to analyze statistics week over week.
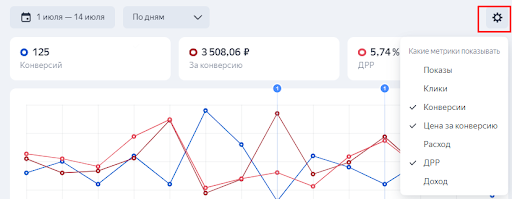
If you don't need all of the displayed data, click the metrics you wish to hide or the gear icon in the corner. Grayed-out boxes and deselected metrics are excluded from the chart.
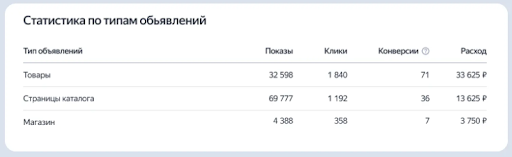
Statistics by ad type
Displays data for a specific period selected in the calendar. It helps you quickly assess the effectiveness of different ad types.
Statistics for ads
Displays impression, click, and conversion data for products, categories, and manufacturers. If you have E-commerce configured in Yandex Metrica, this section will provide additional data, such as the number of times a product was added to cart, the number of purchases, and the cost revenue ratio. This report helps you determine whether you need to make adjustments to the settings or structure of your campaign.
Ad elements
The Ad elements report gives you insights into the performance of each ad element in the selected campaign. The effectiveness metric accounts for both the overall attractiveness of the ad element and the expected conversion rate. Titles are compared with titles, texts with texts, and so on. Sitelinks are added to all ad combinations, hence their effectiveness isn't calculated.
Effectiveness calculation starts after the system accumulates source data for the element. If an ad element was added or removed within the selected period, you'll get a warning that statistics are available for an incomplete period.
To view full statistics, select the period when ad elements didn't change. For example, the first version of the title was added on September 20, and the second one was added on September 21. To compare them, select September 21 or later as your start date.
Regions
With the Regions statistics, you can check your performance across different geographic areas.
Product campaigns support only the automatic attribution model. You can compare the metrics of your product campaign with other ad types in the Report Wizard. Statistics are also delivered over the API.
Have questions?
Alert
Our customer support can only assist you with campaigns linked to the username you are contacting us from. You can check your username by opening ya.ru in another browser tab. Our team can access your data only when processing your request.
Scan the QR code or tap it to follow the link.


If you select Telegram or WhatsApp, keep in mind that Yandex does not control and is not liable for how third-party messengers store your data and chat history.