Checking the progress of an ad campaign
With Adfox, you can track the progress of your campaign and see its projected ad delivery.
To check a campaign's progress, go to the Campaigns tab. You can view the progress in the Actual / Prediction column.
Clicking the line with the campaign opens a side panel that shows the campaign's general settings as well as its current and forecasted progress. For accounts with the Campaign/flight/banner hierarchy module enabled, the campaign progress (“Actual/Prediction” column) is available at the flight level.
Note
If there is no Actual / Prediction column in the list of campaigns, click above the list and check whether the display of this column is enabled in the Column Settings window.
Updated approach for evaluating campaign success
Warning
On June 3, 2026, we updated the logic for forecasting the ad delivery of campaigns.
The Plan compliance metric was replaced by Execution forecast.
The Actual/Plan column was renamed to Actual/Prediction.
Old approach
Plan compliance showed how well your current ad delivery kept up with the planned rate.
Calculation formula:
Plan compliance = Actual show rate / Expected show rate * 100%
This metric answered the question: Is the campaign on schedule right now?
With that approach:
- Only actual impressions were analyzed.
- Expected impressions were estimated assuming the campaign's ad delivery was evenly distributed throughout the entire placement period.
Limitations of this approach
The metric didn't consider:
- Contending campaigns on the same inventory.
- Actual available traffic for the placements.
- Impact of targeting options and frequency capping.
- Differences in weekday and weekend performance.
Because of this, it failed to answer the primary question: Will the campaign meet the plan by the end of the placement period?
New metric: Execution forecast
Now, the Actual/Prediction column shows the Execution forecast metric.
It represents the percentage of the planned ad delivery the campaign is expected to achieve by the end of the placement period.
Calculation formula:
Execution forecast = f(current ad delivery rate, historical traffic, contending campaigns, inventory, targetings, limits)
Difference from the old metric
Unlike Plan compliance, the new metric:
- Not only evaluates the campaign's current metrics, but also forecasts its future performance.
- Accounts for factors that may impact ad delivery during the placement period.
- Uses historical traffic data, factoring in differences in weekday and weekend performance.
What's factored into the forecast
- Current ad delivery rate.
- Historical traffic for the placements.
- Differences in weekday and weekend performance.
- Contending campaigns with higher priority.
- Available inventory for the placements.
- Configured targeting options.
- Impression frequency capping and daily limits.
Note
The forecast value may differ slightly from your current campaign status because the data refreshes at 5-minute intervals.
The tooltip always indicates the time of the last forecast.
In addition, opening a campaign recalculates the forecast based on more recent data, so you may see different values.
Approach comparison
|
Criteria |
Old: Plan compliance |
New: Execution forecast |
|
Formula |
Actual ÷ Expected delivery |
Multi-factor model |
|
Scope of analysis |
Past and present |
Future (until the end of the campaign) |
|
Considers historical traffic |
No (even distribution) |
Yes (weekday, weekend, and seasonality) |
|
Considers contending campaigns |
No |
Yes |
|
Considers inventory |
No |
Yes |
|
Considers targeting options |
No |
Yes |
|
Update frequency |
Real-time |
Automatic daily updates |
|
Primary question |
Is the campaign on schedule? |
Will the campaign meet the plan? |
Checking the progress of a campaign with a general limit
For campaigns with a general limit on the number of impressions and/or clicks, the campaign progress is represented as a process indicator, with the following metrics being available:
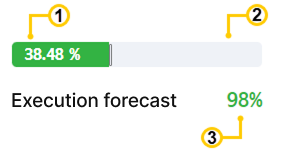
1. Actual show rate
-
Shown as a percentage. Calculated using the following formula:
Actual rate = Actual impressions / Total impression limit * 100%To sort the list of campaigns by the actual rate, click Actual ↓ in the column name. Campaigns will be sorted in the descending order. If you click it again, the order will be switched to ascending.
2. Expected show rate
-
Indicated by the
|label on the indicator. Calculated using the following formula:Expected rate = Potential impressions / Total impression limit * 100%The number of potential impressions is calculated based on the assumption that they are evenly distributed over time during the entire campaign period.
Note
The metric is not displayed if the campaign end date is not set.
3. Execution forecast
-
The execution forecast shows the percentage of the planned ad delivery the campaign is expected to achieve by the end of the period. The progress bar displays the current progress, and the number on the right shows the projected completion.
The progress bar is color-coded to reflect the execution forecast:
Forecast
Color
Value
Action
≥ 95%
🟢 Green
The campaign will deliver on the plan.
No action required.
80–94%
🟡 Orange
Risk of underdelivery.
Review your parameters.
< 80%
🔴 Red
The campaign will not deliver on the plan.
Action required.
Can't generate
⚪ Gray
Can't generate a forecast for this campaign.
Check the campaign for compliance with forecasting principles and existing limits.
Display rules
- Green: prediction ≥ 95%.
- Orange: 80% ≤ prediction < 95%.
- Red: prediction < 80%.
- Gray: can't generate a forecast for this campaign.
Note
The metric is not displayed if the campaign end date is not set.
Information about the campaign's compliance with its delivery plan is still available and appears in the Progress column as a ratio of the actual to expected rate. Calculated using the following formula:
Progress = Actual show rate / Expected show rate * 100%The Progress metric in the table estimates Plan compliance, showing how well the campaign's actual ad delivery meets the projected rate. This tooltip value is calculated based on current ad delivery data and assumes an even impression distribution over time.
1. Actual share of clicks
-
Shown as a percentage. Calculated using the following formula:
Actual rate = Actual clicks / Total click limit * 100%To sort the list of campaigns by the actual rate, click Actual ↓ in the column name. Campaigns will be sorted in the descending order. If you click it again, the order will be switched to ascending.
2. Expected share of clicks
-
Indicated by the
|label on the indicator. Calculation formula:Expected rate = Potential clicks / Total click limit * 100%The number of potential click-throughs is calculated based on the assumption that they are evenly distributed over time during the entire campaign period.
Note
The metric is not displayed if the campaign end date is not set.
3. Execution forecast
-
The execution forecast shows the percentage of the planned ad delivery the campaign is expected to achieve by the end of the period. The progress bar displays the current progress, and the number on the right shows the projected completion.
The progress bar is color-coded to reflect the execution forecast:
Forecast
Color
Value
Action
≥ 95%
🟢 Green
The campaign will deliver on the plan.
No action required.
80–94%
🟡 Orange
Risk of underdelivery.
Review your parameters.
< 80%
🔴 Red
The campaign will not deliver on the plan.
Action required.
Can't generate
⚪ Gray
Can't generate a forecast for this campaign.
Check the campaign for compliance with forecasting principles and existing limits.
Display rules
- Green: prediction ≥ 95%.
- Orange: 80% ≤ prediction < 95%.
- Red: prediction < 80%.
- Gray: can't generate a forecast for this campaign.
Note
The metric is not displayed if the campaign end date is not set.
Information about the campaign's compliance with its delivery plan is still available and appears in the Progress column as a ratio of the actual to expected rate. Calculated using the following formula:
Progress = Actual click rate / Expected click rate * 100%The Progress metric in the table estimates Plan compliance, showing how well the campaign's actual ad delivery meets the projected rate. This tooltip value is calculated based on current ad delivery data and assumes an even impression distribution over time.
If a campaign has impression and click limits, the indicator only shows campaign progress related to clicks.
Filtering and sorting
You can filter and sort campaigns according to their execution forecast:
Sorting: Click the header of the Actual / Prediction column to sort your campaigns by forecast (from worst to best or vice versa).
Filtering by forecast:
🟥 High risk (prediction < 80%): Campaigns that won't deliver on the plan.
🟨 Medium risk (80–95%): Campaigns at risk of underdelivery.
🟩 Low risk (≥95%): Campaigns with a chance of slight underdelivery.
Checking the progress of a campaign without impression and click limits
If there are no impression or click limits set for the campaign:
- Its progress is displayed as a chart with data on impressions (clicks) for the last 7 days:
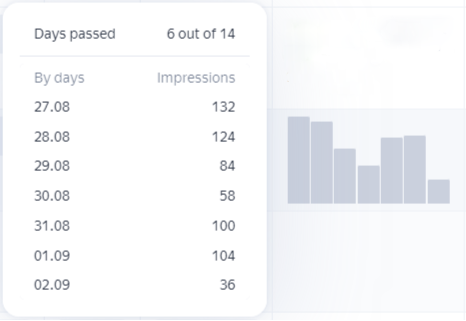
- Because these campaigns have no target volume, no forecast can be built for them.
If there were no impressions or clicks for the campaign in the last 7 days, the campaign progress chart is not available.
FAQ
Why did the column value change?
Previously, the column showed the Plan compliance parameter: Plan compliance = Actual delivery ÷ Expected delivery (current status). Now, the column displays a Prediction that forecasts the campaign's ad delivery by the end of the placement period. Because these are different metrics, the forecast may be higher or lower than the compliance parameter.
My campaign changed from green to red. What happened?
The forecast accounts for more factors than the plan compliance metric. While your campaign might be keeping up with its plan right now, the forecast projects that contending campaigns or a lack of inventory will prevent it from delivering in full by the end of the placement period. Think of this as an early warning.
Can I see the old Plan compliance metric?
Yes, you can. Your current plan compliance is available as a tooltip in the Progress column.
What should I do if my campaign turns red?
To review possible reasons, open the campaign's Forecast.
Consider increasing priority, expanding the targeting, or adding more placements.