Statistics and monitoring
Reports
The Partner Interface provides three types of reports to help you analyze your metrics, performance, and earnings over a specified period.
You can find these reports on the Statistics page.
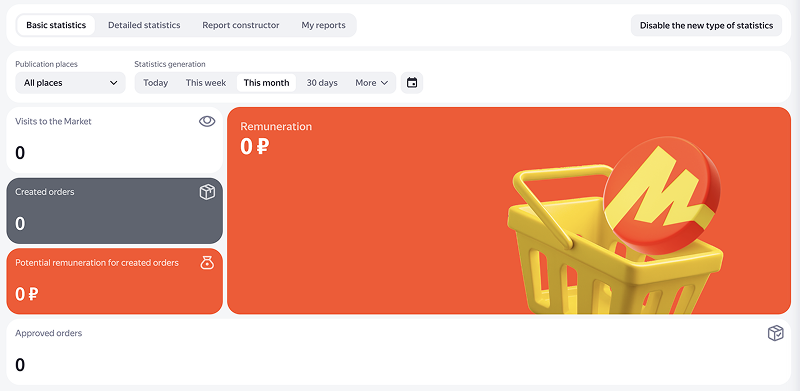
This tab shows cards with your key metrics and revenue information for the selected service and properties.
To generate a report:
- Select the service for which you would like to get a report. If you work with only one service, it's selected by default, and the service filter is unavailable.
- Select a property. You can also view data for all your properties by selecting All places.
- Specify the period.
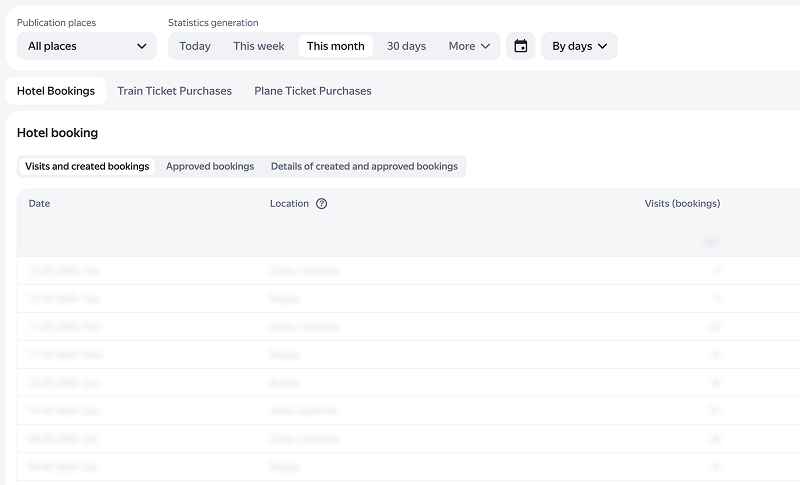
On this tab, you can get detailed reports on specific metrics. Each service has its own metrics. For example, you will see orders for Yandex Market and bookings for Yandex Travel.
Reports are available for the following programs: Yandex Market, Yandex Travel, Yandex Direct, and Yandex Business. You will only see data for the programs you have joined. If you haven't joined any of these programs, the Detailed statistics tab will be hidden.
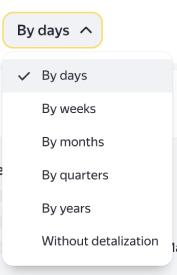
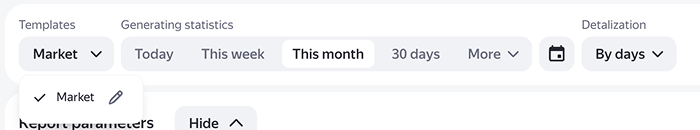
To get a report, specify a service, property (or select All places), desired period, and level of detail, if needed. If you don't want to group data by time, select without detalization in the drop-down list.
Sample reports for various services
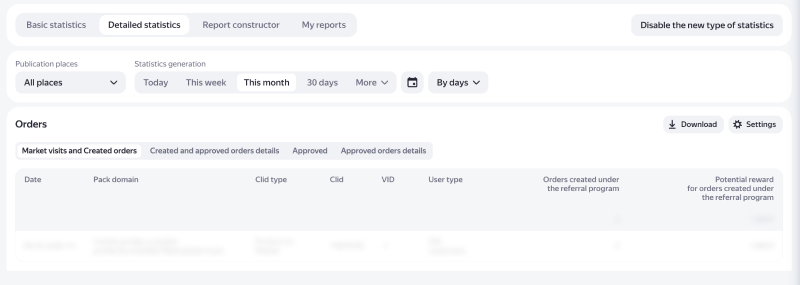
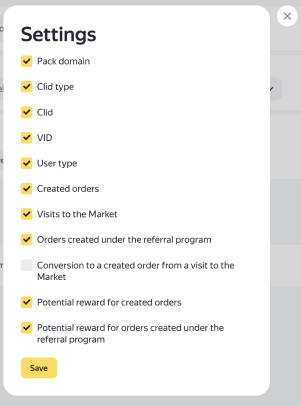
You can customize the report fields to better suit your needs by clicking Settings in the upper-right corner.
You can save a report in XLS format by clicking Save in the upper-right corner.
On this tab, you can create a custom report on a specific service, all services, period, metrics, IDs, packages, or other data.
To generate a report:
-
Specify a service or select All services.
With All services selected, you can view all metrics. If you select a specific service, only the metrics for that service will be available.
If you only work with one service, statistics for that service will be displayed by default.
-
Set the report parameters by selecting:
-
Metrics, Analytical metrics, and Partner reward.
-
CLIDs and builds, Packs, Contracts.
-
Select In list or Not in list.
-
-
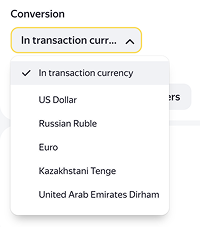
Select the conversion currency. In transaction currency is selected by default.
-
Click Create report.
To save a report, download it to your computer in XLS format by clicking Save in the upper-right corner.
You can save the created report as a template by clicking Save template in the upper-right corner.
Name the report and save your changes. The template will then appear in the drop-down menu along with your other templates. To edit the template, click the pencil icon next to its name.
Program interface (API)
The API lets you automate the receipt of statistical data. Check the documentation for instructions on how to use the API.
You can also go to
![]()