Segment statistics
You can view statistics for any segment in the “Finished” status. To view statistics, click  in the segment row.
Statistics show the segment coverage and the distribution of users in it by gender, age, location and types of devices used. Also, you can see similarities between users in the segment, their common categories and interests, and statistics for sites and Yandex Metrica goals.
Users similarity
Similarity shows how the users of a segment have similar behavior on the Internet. Similarity is based on the visited sites, search query categories, social and demographic profile (gender, age, city of residence and other characteristics). The higher the similarity, the more uniform behaviour the segment users have. This type of segment works well for the similar users search. Low similarity means that the segment includes heterogeneous users (young and old, with low and high income, from different cities, and so on). In such segment, it is hard to find common features, so the users found are also different.
Site statistics and Yandex Metrica goals
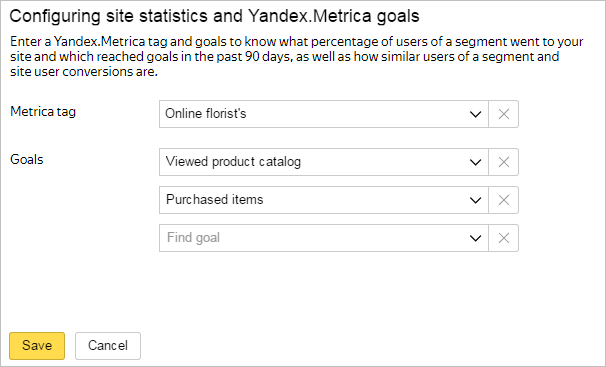
Use site statistics to learn the percentage of users in the segment who visited the site or reached the Yandex Metrika goals. You can configure statistics in the Main tab any time after the segment is created.
Specify the tag and up to three Yandex Metrika goals. You can use your own tags and goals or someone else's if they gave you or . Statistics collection takes several hours.
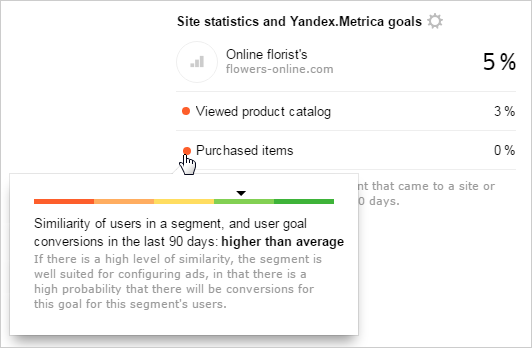
When statistics collection is finished, you can view the percentage of users in the segment, who visited the specified site. If you set goals when configuring statistics, you can also see the share of users in the segment who completed each of these goals. Point the cursor at the circle next to the goal name to view the similarity of users in the segment and the similarity of the internet users who reached this goal. Statistics is available for the recent 90 days.
For example, you received the following site data:
Statistics show that some users in the segment visited your site and viewed the catalog but didn't buy anything. Also, they are similar to those who bought products on the site. There is a high probability that users in this segment will be interested in buying something. To drive them closer to a purchase, you can serve them ads with special offers and discounts.
To change the source site or goals, click  .
.
Interests and user categories
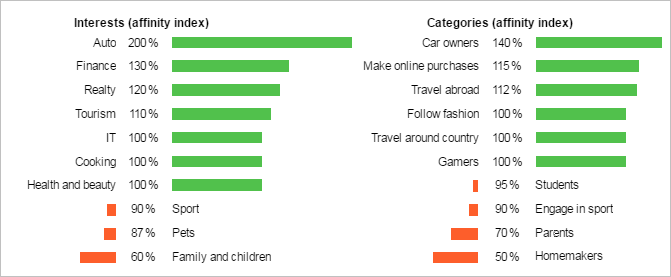
In the Interests and categories tab, you can view what interests users on the internet, and what category they might belong to. For each topic and category, affinity index is calculated. This indicates how strongly the topic interests the users from certain category compared to the internet audience on the average:
For example, you received the following segment data:
The 100% index value indicates that the users are interested in “Cooking” to the same extent as internet users on average. The 200% index value for car owners indicates that the users in the segment are twice more often interested in this topic than the usual internet users. The 140% and 50% index values for the categories indicate that there are 1.4 times more car owners and housewives in the segment than on the internet on the average.
Still have questions?
Alert
Customer support agents can only assist you with campaigns associated with your username. You can see your current username it in the upper-right corner of the screen. The agent will get access to your data only when processing your request.
Message in WhatsApp

The number of anonymous user identifiers found in the segment. Since one user can use several devices, apps, and browsers, the number of found users and the segment reach may differ.