Yandex Metrica reports. Site traffic statistics
Site traffic statistics is a useful tool for understanding a site's effectiveness and audience quality, which are two fundamental factors of a successful internet resource. Statistics are collected based on Yandex Metrica data.
Yandex Metrica operates based on the traditional tracking tag principle: code inserted on the pages of your site registers each visit and collects data on them. Yandex Metrica creates reports and maps of user actions. Data aggregated by the Yandex Metrica tag is read-only and cannot be edited.
How Yandex Metrica can help
You can use Yandex Metrica to find out:
-
What users do on the site:
- How convenient site navigation is for them. Which navigation elements are used actively, and which ones are not used or are not visible to users.
- Which content is most interesting to them. Which sections or pages are visited most frequently, and which ones are mostly ignored.
- How they view content. If the content is fully viewed, or if users leave pages for various reasons.
-
How successfully ad units are positioned:
- If ad units fall into the user's field of view.
- If ad units interfere with site content.
- Which ad locations provide the highest CTR, and why.
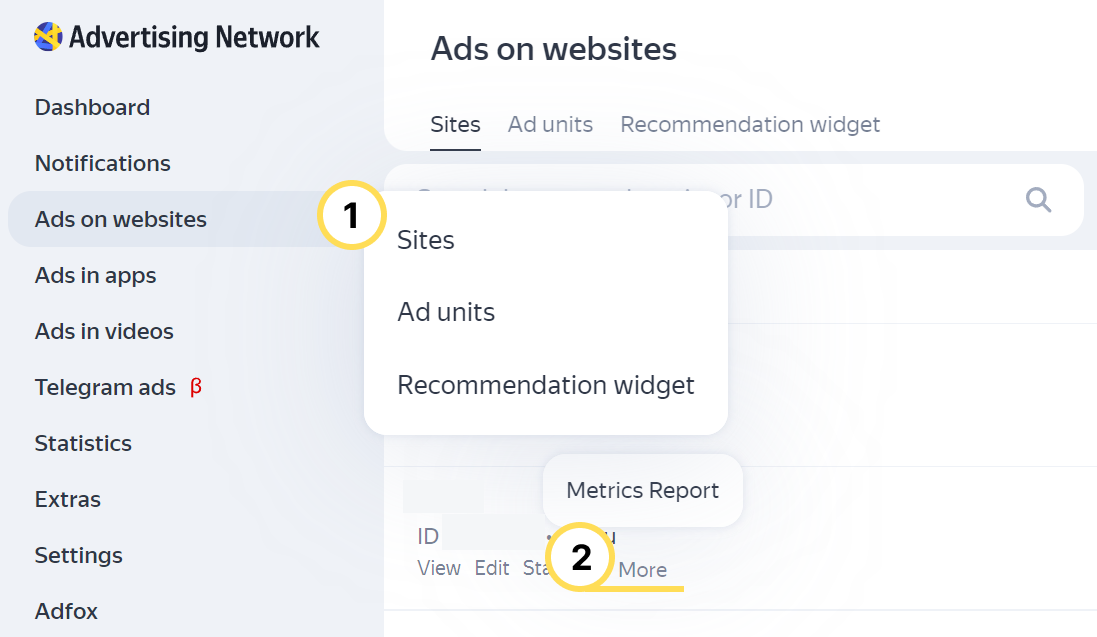
How to view a report in Yandex Metrica
-
In the Yandex Advertising Network interface, go to Websites Ads → Sites.
-
Click More → Metrics report under the site name.
How it looks in the interface
How to connect a Yandex Metrica tag
-
In the Yandex Advertising Network interface, go to Websites Ads → Sites.
-
Click Edit under the site name.
-
Open the General tab and enable the option Show YAN reports in Yandex Metrica.
-
Add the tag number in the Metrica tags field.
Reports will appear in Yandex Metrica within 24 hours.
Note
Since Yandex Advertising Network ad code is usually not inserted on all pages of a site, the data collected by Yandex Metrica may be incomplete. We recommend that you create and configure a new tag in Yandex Metrica and install the code snippet on all of your site pages. This will help you more accurately determine the site quality and obtain additional reports on the site traffic. The Yandex Metrica tag only serves as a data collector and does not show any ads.
Yandex Metrica features
-
Standard reports:
For a detailed description, see Yandex Metrica Help.
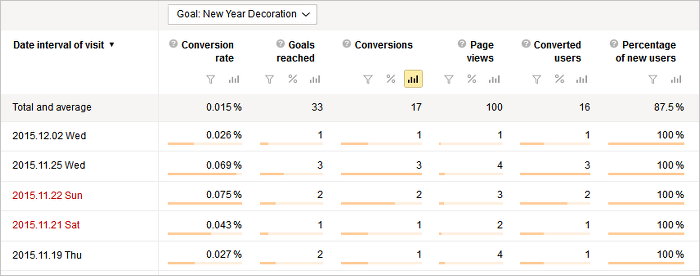
Monetization
Use Standard reports → Monetization to estimate your ad revenue based on multiple metrics. For example, you can identify the most profitable traffic sources or check ad performance on different pages of your site.
For more information about Monetization reports, see Yandex Metrica Help.
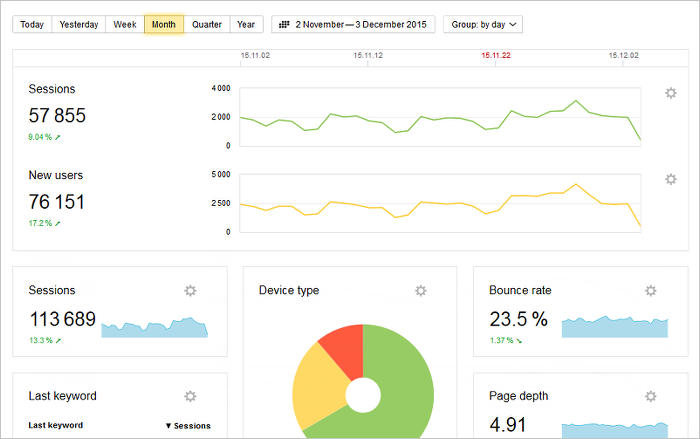
Summary
Summary is the main page of your Metrica reports and enables you to quickly obtain information on traffic and other important indicators.
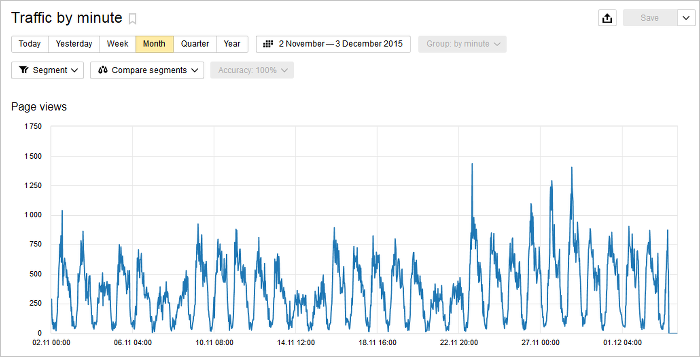
Traffic
The Standard reports → Traffic report shows your site's traffic for any period you choose.
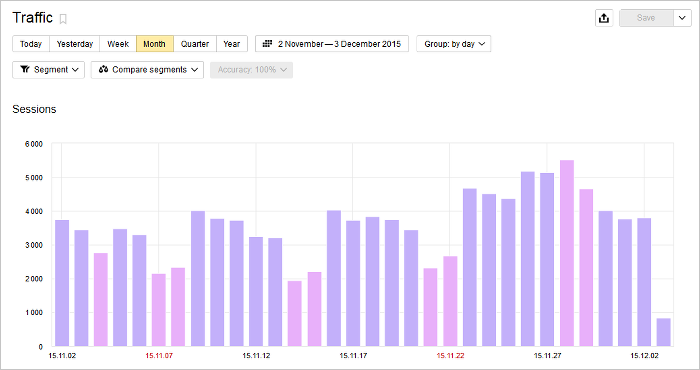
Use it to track overall traffic trends and forecast earnings from your site based on the relationship between traffic and revenue.
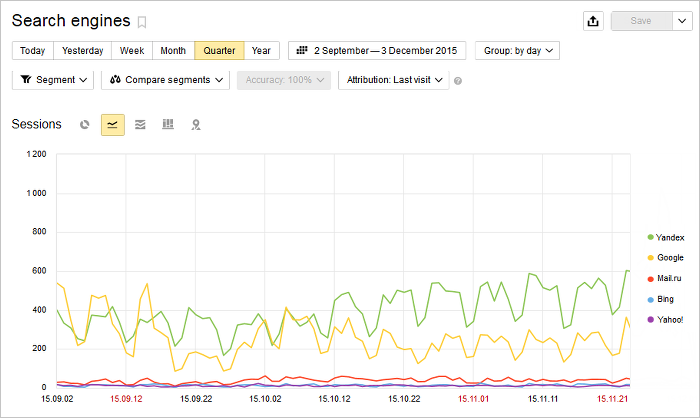
Sources
In order to assess traffic quality, you must first understand where the traffic came from. To see where your traffic is coming from, check the reports from Standard reports → Sources menu, such as Sites, Keywords, or Social networks.
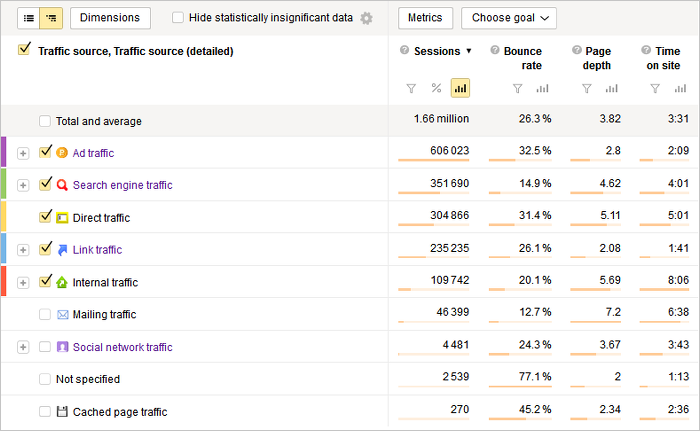
Low-quality traffic degrades the indicators for your site and negatively affects revenue. Genuine search traffic is the optimal source of traffic for your site.
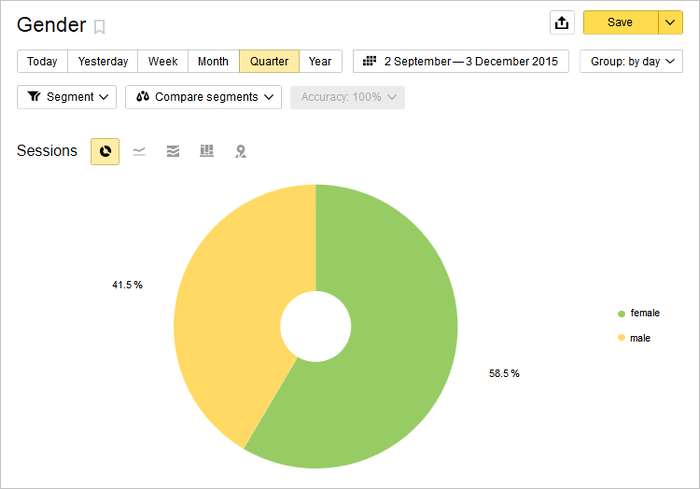
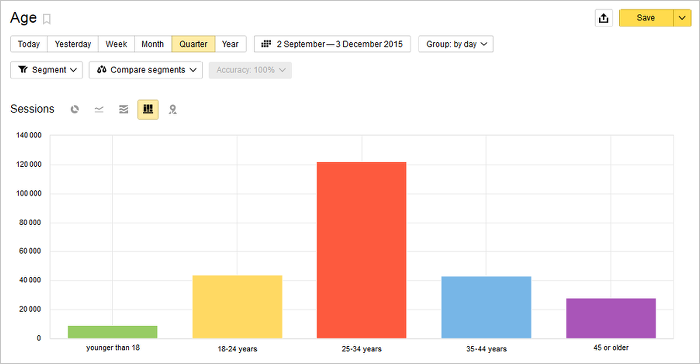
Visitors
Use Standard reports → Users to understand your audience's demographics and interests. This way, you can evaluate how effective Yandex Advertising Network ad units are.
The Long-term interests report shows which subjects are more interesting to users of your site. By analyzing users' preferences, you can identify the best way to develop your site.
The Geography report helps you understand the geography of your audience.
Use the reports in the Demographics section to assess the distribution of your audience by age and by gender.
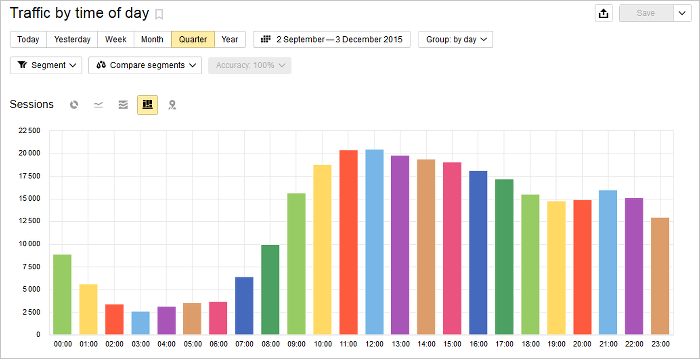
The reports for the Activity block let you find out how much time users spend on your site, what the average page view depth is, and how traffic depends on the time of day.
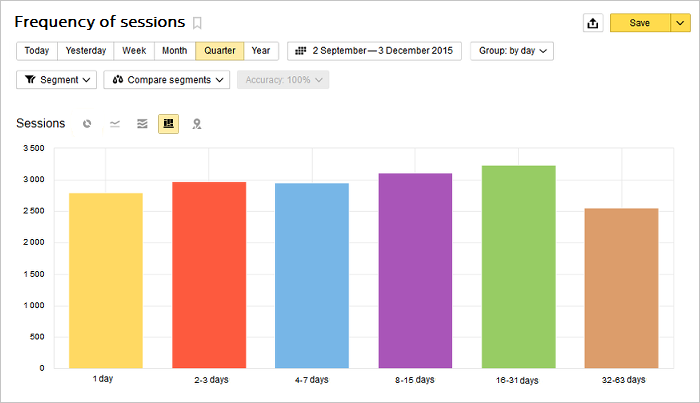
Use the Loyalty reports to evaluate the number of sessions per user, their frequency of sessions, the time interval between the last two sessions, and the time interval between the user's first and last session.
Content
Use Standard Reports → Content to determine the most visited pages on your site, see session details (like currency and language), and review URL parameters. You can learn which pages on your site users land on, what pages they leave from after viewing your site, and what pages are shared on social networks. An analysis of this information can help you predict the behavior of your audience and prioritize while improving the quality of your pages.
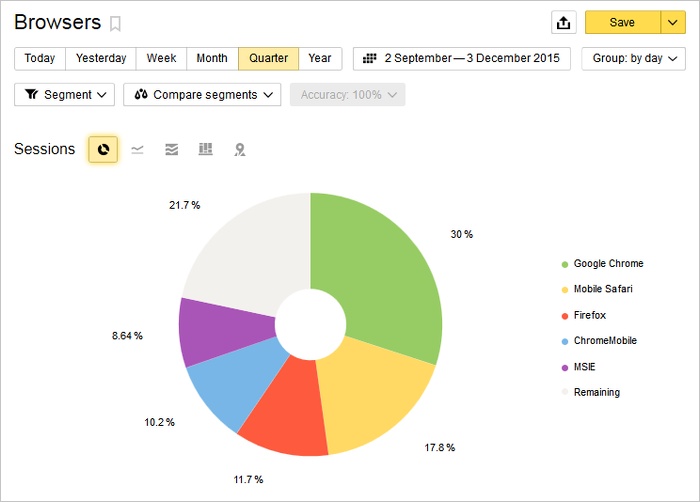
Technologies
Use Standard reports → Technology to see what software and which devices people use to browse your site. Information about operating systems and users' browsers, their screen resolutions, and the presence and versions of Flash plugins, Java, JavaScript, and Silverlight is detailed in these reports. Make sure your site is correctly displayed in popular browsers.
Monitoring
Use Standard reports → Monitoring to check site availability, track load in real time, see average page load time, and view how many robots visit your site.
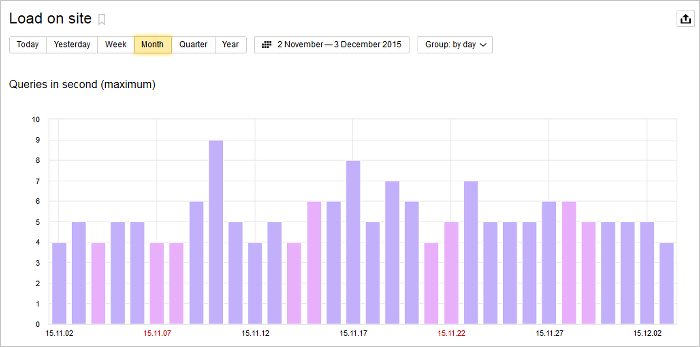
Analysis of monitoring reports helps keep track of potential problems with site access (for instance if a site cannot cope with a large number of users).
My reports
Any Yandex Metrica report can be changed for a more complete and accurate measurement of the required indicators of your site. You can access your saved reports from the Reports → My reports menu.
Maps
Maps enable you to understand the behavioral logic of users on your site:
-
Link map tracks click statistics for the links on your site.
-
The click map (often called a heat map, though it's more advanced) shows where users click on your site, offering valuable statistics. In contrast to a link map, a click map displays clicks on all page elements and not just on links.
-
Scroll map shows how the attention of users is distributed on a page. This information can help you decide where to place Yandex Advertising Network ad units.
-
Form analysis allows you to understand how users of your site interact with forms. For each form you can find out the conversion rate, the average time to fill it out, and the fields where visitors leave the form.
Session Replay
Session Replay reproduces user actions in video format and enables you to know what they do on the site: how they move around the page, move the mouse cursor, and click through links.
Contact support


You can also go to
![]()