Robots
In this report, you can see data on all robot activity on the site, with a breakdown by filter settings.
To view the report, go to Reports → Monitoring → Robots.
An example of this report is available for the Yandex Metrica demo tag.
Ways to use this report
Check robot activity during increased load on the site
-
If your website is loading slower than usual and often returns a 500 HTTP error code, you can check where most of the requests are coming from: real users or robots.
-
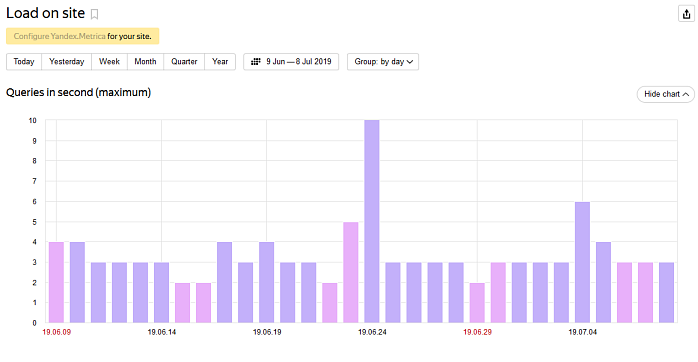
Open the Load on site report. This tells you if there are surges in activity.
Example
-
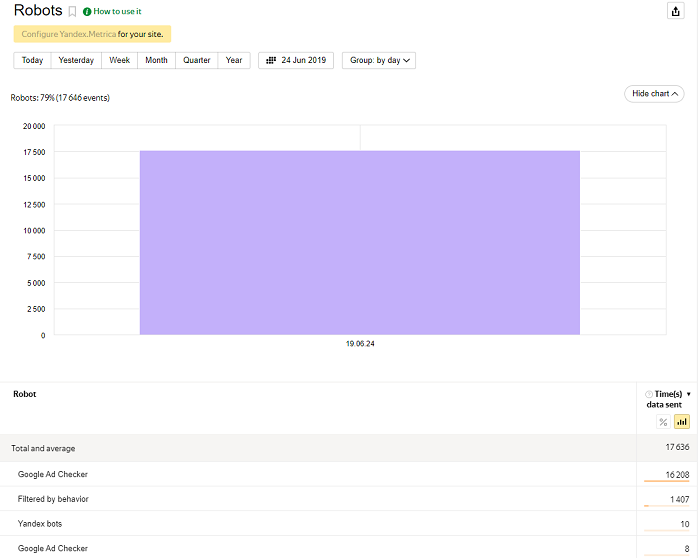
Open the Robots report and select the date or period when you noticed a surge in activity. The report also displays requests sent by robots and their names.
Example
-
Report structure and settings
The table shows the number of times the Yandex Metrica tag sent data about robot activity on the site (other than Session Replay sending data).
The Time(s) data sent metric represents the number of views and other service events, such as hit function calls and non-bounces, that were triggered by robots.
The information is displayed in rows, broken down by filtration rules. Behavior filters are shown in a separate line and don’t include further details. Other lines indicate the name of the robot declared in the User-agent directive.
If the line specifies the rule “Filtered by missing JS and Referer”, this means that the user didn't have JavaScript support, and when the image was loaded, the HTTP Referer header (the address of the viewed page) wasn't passed.
More information
The counter code consists of two parts — the JavaScript code and an invisible image specified in the noscript element. If JavaScript is not supported or is disabled during the user’s session, the image is loaded to pass information about the viewed page in the HTTP Referer header. If the HTTP header is not passed, Yandex Metrica interprets it as a robot session.
Learn more
|
Useful links |
Online training |