Setting up and viewing a report
Note
Yandex Metrica protects users' privacy and ensures that all collected information is depersonalized. For this reason, some data is not fully disclosed.
Reports contain statistical information about a site and are divided into standard reports (offered by the service) and custom reports.
A Yandex Metrica report is a constructor that you can configure:
- Add or remove dimensions and metrics.
- Add goals and segments.
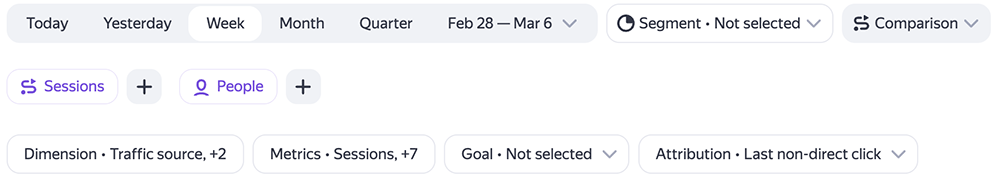
Controls are located on the control panel at the top of the report page.
Reports are built on sets of dimensions and metrics. The dimension at the top of the list determines the content of the report. If you change the set of dimensions or their order, the content of the report changes, although the name remains the same.
For example, by default, the "Sources, summary" report is based on dimensions. If you add the Session date dimension and place it at the top of the list, the report is rebuilt to display statistics for all sources of sessions on the site.
Creating a report
-
In the side menu, go to the Reports tab.
-
At the bottom of the page, click Create report → Report. By default, the new report will have the report type Sources, summary.
-
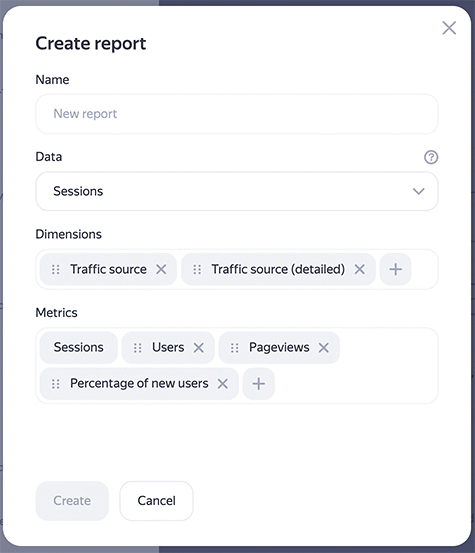
In the Create report window that opens:
-
Give your report a name.
-
Select the type of data the report should be based on: sessions, pageviews, costs, market comparison (if available).
-
Select the dimensions and metrics you want to use to build the report.
-
-
Click Create.
You'll see the generated report. It will appear on the Saved to account page.
Setting up a report
You can use the tools described below to set up your report:
1. Report period
- You can select a calendar time period to build the report for. You can also set a date range by clicking June 26–July 27, 2015.
2. Dimensions and metrics
-
Each report contains metrics grouped into dimensions.
To form a report, click Dimensions or Metrics. In the window that opens, select the parameters to base the report on. They will be displayed in the right half of the window.
Alert
A report can have a maximum of 7 dimensions and 10 metrics.
Dimensions
TrafficType
Description
Traffic source
Traffic source (detailed)
Second level of the traffic source
Advertising system
Referral traffic
Sites that were traffic sources
Click from messenger
Click from recommendation system
QR code provider
Last significant source
-
Last significant traffic source
-
Last significant traffic source (detailed) — second level of traffic sources
-
Last significant ad system
-
Last significant referral traffic — sites that were traffic sources
-
Last non-direct click from messenger
-
Last non-direct click from recommendation system
-
QR code provider
Search
-
Last significant search engine — ID of the top level in the search engine hierarchy for the user's first session. For example, Yandex
-
Last significant search engine (detailed) — ID of the refined search engine for the user's first session. For example, Yandex Images
-
Last significant keyword — keyword that resulted in the last non-direct click from a search engine
Social networks
-
Last significant social network — social media site where the user's last non-direct click originated
-
Social media page where the last non-direct click originated — social network page of last non-direct user click during data collection period
Yandex Direct
-
Yandex Direct campaign — campaign ID in Yandex Direct
-
Ad group — Yandex Direct ad group
-
Yandex Direct ad — title of a Yandex Direct ad
-
Ad impression condition — impression condition. A condition can be a keyword or a retargeting condition.
-
Platform type — type of Yandex Direct platform where the ad is served
-
Platform — Yandex Direct ad platform
-
Keyword (Yandex Direct) — keyword that resulted in the last click on a Yandex Direct ad
Expanded dimensions
-
Type of ad impression condition — type of impression condition
-
Currency — currency set in the Yandex Direct campaign
Display
Yandex Display order number
Labels
-
"From" tag
-
UTM Campaign — name of the ongoing ad campaign
-
UTM Content — ad
-
UTM Medium — marketing tool
-
UTM Source — traffic source
-
UTM Term — keywords
-
Openstat Ad — ad
-
Openstat Campaign — ad campaign
-
Openstat Service — advertising service
-
Openstat Source — ad display location
-
GCLID presence — presence of the GCLID tag
Last source
-
Last traffic source
-
Traffic source (detailed) — second level of traffic sources
-
Last ad system
-
Last referral traffic — sites that were traffic sources
-
Click from messenger
-
Click from recommendation system
-
QR code provider
Search
-
Last search engine — ID of the top-level search engine hierarchy
-
Last search engine (detailed) — refined search engine ID
-
Last keyword — keyword that resulted in the last click from a search engine
Social networks
-
Last social network — traffic source — social network ID
-
Social network referral page — social network page
Yandex Direct
-
Yandex Direct campaign — campaign ID in Yandex Direct
-
Ad group — Yandex Direct ad group
-
Yandex Direct ad — title of a Yandex Direct ad
-
Ad impression condition — impression condition. A condition can be a keyword or a retargeting condition.
-
Platform type — type of Yandex Direct platform where the ad is served
-
Platform — Yandex Direct ad platform
-
Keyword (Yandex Direct) — keyword that resulted in the last click on a Yandex Direct ad
Expanded dimensions
-
Type of ad impression condition — type of impression condition
-
Currency — currency set in the Yandex Direct campaign
Display
- Yandex Display order number
Labels
-
"From" tag
-
UTM Campaign — name of the ongoing ad campaign
-
UTM Content — ad
-
UTM Medium — marketing tool
-
UTM Source — traffic source
-
UTM Term — keywords
-
Openstat Ad — ad
-
Openstat Campaign — ad campaign
-
Openstat Service — advertising service
-
Openstat Source — ad display location
-
GCLID presence — presence of the GCLID tag
First source
-
First traffic source
-
First traffic source (detailed) — second level of traffic sources
-
First ad system
-
First referral traffic
-
Sites that were traffic sources
-
First click from a messenger
-
First click from a recommendation system
-
QR code provider
Search
-
First search engine — ID of the top level in the search engine hierarchy for the user's first session
-
First search engine (detailed) — ID of the refined search engine for the user's first session. For example, Yandex Images
-
First keyword — keyword of first click from a search engine
Social networks
-
First social network — social network where the user's first click originated
-
First social network page — social media page where the user's first ever click originated
Yandex Direct
-
Yandex Direct campaign — campaign ID in Yandex Direct
-
Ad group — Yandex Direct ad group
-
Yandex Direct ad — title of a Yandex Direct ad
-
Ad impression condition — impression condition. A condition can be a keyword or a retargeting condition.
-
Platform type — type of Yandex Direct platform where the ad is served
-
Platform — Yandex Direct ad platform
-
Keyword (Yandex Direct) — keyword that resulted in the last click on a Yandex Direct ad
Expanded dimensions
-
Type of ad impression condition — type of impression condition
-
Currency — currency set in the Yandex Direct campaign
Display
- Yandex Display order number
Labels
-
"From" tag
-
UTM Campaign — name of the ongoing ad campaign
-
UTM Content — ad
-
UTM Medium — marketing tool
-
UTM Source — traffic source
-
UTM Term — keywords
-
Openstat Ad — ad
-
Openstat Campaign — ad campaign
-
Openstat Service — advertising service
-
Openstat Source — ad display location
-
GCLID presence — presence of the GCLID tag
Yandex Market
- Keyword (Market) — keyword that resulted in the last click on a Yandex Market ad
Search
-
Search engine — ID of the top-level search engine hierarchy
-
Search engine (detailed) — refined search engine. For example, Yandex Images
-
Keyword — keyword from search engine
Social networks
-
Social network — traffic source — social network ID
-
Social network group — social network page
Yandex Direct
-
Yandex Direct campaign — campaign ID in Yandex Direct
-
Ad group — Yandex Direct ad group
-
Yandex Direct ad — title of a Yandex Direct ad
-
Ad impression condition — impression condition. A condition can be a keyword or a retargeting condition.
-
Platform type — type of Yandex Direct platform where the ad is served
-
Platform — Yandex Direct ad platform
-
Keyword (Yandex Direct) — keyword that resulted in the last click on a Yandex Direct ad
Expanded dimensions
-
Type of ad impression condition — type of impression condition
-
Currency — currency set in the Yandex Direct campaign
Display
- Yandex Display order number
Referrer
-
Referrer — referrer URL
-
Referrer protocol
-
Referrer domain
-
Referer path (full) — part of the referrer URL right after the domain. Unlike a simple path, it also includes parameter and fragment sections
-
Referrer path — part of the referrer URL right after the domain up to
?(parameter section),#(fragment section) or up to the end of the string. For example, for the pagehttp://news.yandex.ru/quotes/1.html, the path is/quotes/1.html, forhttp://news.yandex.ru/, it is/, and forhttp://news.yandex.ru, it is an empty string -
Referrer, level 1 — first level of the referrer URL. For example, for
http://ya.ru/1/2/3/4.html, the first level of the URL ishttp://ya.ru/ -
Referrer, level 2 — second level of the referrer URL. For example, for
http://ya.ru/1/2/3/4.html, the second level of the URL ishttp://ya.ru/1/ -
Referrer, level 3 — third level of the referrer URL. For example, for
http://ya.ru/1/2/3/4.html, the third level of the URL ishttp://ya.ru/1/2/ -
Referrer, level 4 — fourth level of the referrer URL. For example, for
http://ya.ru/1/2/3/4.html, the fourth level of the URL ishttp://ya.ru/1/2/3/ -
Referrer, level 5 — fifth level of the referrer URL. For example, for
http://ya.ru/1/2/3/4.html, the fifth level of the URL ishttp://ya.ru/1/2/3/4.html
External referrer
-
External referrer — URL of the external referrer for the "Link traffic" source
-
External referrer protocol
-
External referrer domain
-
External referrer path (full) — part of the external referrer URL right after the domain. Unlike a simple path, it also includes parameter and fragment sections
-
External referrer path — part of the external referrer URL right after the domain up to
?(parameter section),#(fragment section) or up to the end of the string. For example, for the pagehttp://news.yandex.ru/quotes/1.html, the path is/quotes/1.html, forhttp://news.yandex.ru/, it is/, and forhttp://news.yandex.ru, it is an empty string -
External referrer level 1 — first level of the external referrer URL. For example, for
http://ya.ru/1/2/3/4.html, the first level of the URL ishttp://ya.ru/ -
External referrer level 2 — second level of the external referrer URL. For example, for
http://ya.ru/1/2/3/4.html, the second level of the URL ishttp://ya.ru/1/ -
External referrer level 3 — third level of the external referrer URL. For example, for
http://ya.ru/1/2/3/4.html, the third level of the URL ishttp://ya.ru/1/2/ -
External referrer level 4 — fourth level of the external referrer URL. For example, for
http://ya.ru/1/2/3/4.html, the fourth level of the URL ishttp://ya.ru/1/2/3/ -
External referrer level 5 — fifth level of the external referrer URL. For example, for
http://ya.ru/1/2/3/4.html, the fifth level of the URL ishttp://ya.ru/1/2/3/4.html
Labels
-
"From" tag
-
UTM Campaign — name of the ongoing ad campaign
-
UTM Content — ad
-
UTM Medium — marketing tool
-
UTM Source — traffic source
-
UTM Term — keywords
-
Openstat Ad — ad
-
Openstat Campaign — ad campaign
-
Openstat Service — advertising service
-
Openstat Source — ad display location
-
GCLID presence — presence of the GCLID tag
BehaviorType
Description
Achieved goal
Dimension by completed goal. Use it to group sessions by goal IDs.
Page depth
Number of pageviews in a session or page depth grouped by intervals
Page depth (detailed)
Number of pageviews in a session or page depth
Page depth (detailed), obsolete
Obsolete version of the
ym:s:pageViewsdimension. Was used prior to the changes in the calculation algorithmTime on site
Time on site broken down into groups
Time on site (detailed)
Session duration in seconds
Bounce rate
Whether this session was a bounce, accounting for the exact bounce rate. If a page was viewed for more than 15 seconds, then the session isn't considered a bounce. Possible values: Yes, No.
Time on site (obsolete)
Obsolete version of the
ym:s:visitDurationIntervaldimension. Was used prior to the changes in the calculation algorithmTime on site (detailed), obsolete
Obsolete version of the
ym:s:visitDurationdimension. Was used prior to the changes in the calculation algorithmBounce rate (obsolete)
Obsolete version of the
ym:s:bouncedimension. Was used prior to the changes in the calculation algorithmRobot activity
The user is suspected to be a robot. Possible values: Yes, No.
Turbo page
Tag
Landing page
-
Landing page
-
Landing page protocol
-
Top-level domain of the landing page
-
Landing page domain
-
Landing page path (full) — part of the landing page URL right after the domain. Unlike a simple path, it also includes parameter and fragment sections
-
Landing page path — part of the landing page URL right after the domain up to
?(parameter section),#(fragment section) or up to the end of the string. For example, for the pagehttp://news.yandex.ru/quotes/1.html, the path is/quotes/1.html, forhttp://news.yandex.ru/, it is/, and forhttp://news.yandex.ru, it is an empty string -
Landing page, level 1 — first level of the landing page URL. For example, for
http://ya.ru/1/2/3/4.html, the first level of the URL ishttp://ya.ru/ -
Landing page, level 2 — second level of the landing page URL. For example, for
http://ya.ru/1/2/3/4.html, the second level of the URL ishttp://ya.ru/1/ -
Landing page, level 3 — third level of the landing page URL. For example, for
http://ya.ru/1/2/3/4.html, the third level of the URL ishttp://ya.ru/1/2/ -
Landing page, level 4 — fourth level of the landing page URL. For example, for
http://ya.ru/1/2/3/4.html, the fourth level of the URL ishttp://ya.ru/1/2/3/ -
Landing page, level 5 — fifth level of the landing page URL. For example, for
http://ya.ru/1/2/3/4.html, the fifth level of the URL ishttp://ya.ru/1/2/3/4.html
Exit page
-
Exit page
-
Exit page protocol
-
Exit page domain
-
Exit page domain
-
Exit page path (full) — part of the exit page URL right after the domain. Unlike a simple path, it also includes parameter and fragment sections
-
Exit page path — part of the exit page URL right after the domain up to
?(parameter section),#(fragment section) or up to the end of the string. For example, for the pagehttp://news.yandex.ru/quotes/1.html, the path is/quotes/1.html, forhttp://news.yandex.ru/, it is/, and forhttp://news.yandex.ru, it is an empty string -
Exit page, level 1 — first level of the exit page URL. For example, for
http://ya.ru/1/2/3/4.html, the first level of the URL ishttp://ya.ru/ -
Exit page, level 2 — second level of the exit page URL. For example, for
http://ya.ru/1/2/3/4.html, the second level of the URL ishttp://ya.ru/1/ -
Exit page, level 3 — third level of the exit page URL. For example, for
http://ya.ru/1/2/3/4.html, the third level of the URL ishttp://ya.ru/1/2/ -
Exit page, level 4 — fourth level of the exit page URL. For example, for
http://ya.ru/1/2/3/4.html, the fourth level of the URL ishttp://ya.ru/1/2/3/ -
Exit page, level 5 — fifth level of the exit page URL. For example, for
http://ya.ru/1/2/3/4.html, the fifth level of the URL ishttp://ya.ru/1/2/3/4.html
Session parameters
-
Session parameter, level 1
-
Session parameter, level 2
-
Session parameter, level 3
-
Session parameter, level 4
-
Session parameter, level 5
-
Session parameter, level 6
-
Session parameter, level 7
-
Session parameter, level 8
-
Session parameter, level 9
-
Session parameter, level 10
Date and time
-
Session date — session date in
YYYY-MM-DDformat -
Session date interval — date interval with parametrization of the interval size
With set accuracy
-
Year of the session — date of the session in
YYYY-MM-DDformat rounded to the beginning of the year -
Quarter of the session — date of the session in
YYYY-MM-DDformat rounded to the beginning of the quarter -
Month of the session — date of the session in
YYYY-MM-DDformat rounded to the beginning of the month -
Week of the session — date of the session in
YYYY-MM-DDformat rounded to the beginning of the week (Monday) -
Hour of the session — date and time of the session in
YYYY-MM-DDHH:mm:ssformat rounded to the beginning of the hour -
Start of decaminute of the session — date and time of the session in
YYYY-MM-DDHH:mm:ssformat rounded to the beginning of the 10-minute interval -
Minute of the session — date and time of the session in
YYYY-MM-DDHH:mm:ssformat rounded to the beginning of the minute -
Session date and time — date and time of the session in
YYYY-MM-DDHH:mm:ssformat (in the tag's time zone)
Date/time fragment
-
Year of the session
-
Month of the session
-
Day of month of the session
-
Day of week of the session
-
Hour of the session — time — beginning of the hour period in
HH:MMformat -
Decaminute of the session
-
Minute of the session
-
Hour and minute of the session
User's date and time
-
Date on the user's computer — date on the user's computer in
YYYY-MM-DDformat -
Date on the user's computer
With set accuracy
-
Year on the user's computer — date and time on the user's computer in
YYYY-MM-DDHH:mm:ssformat rounded to the beginning of the year -
Quarter on the user's computer — date and time on the user's computer in
YYYY-MM-DDHH:mm:ssformat rounded to the beginning of the quarter -
Month on the user's computer — date and time on the user's computer in
YYYY-MM-DDHH:mm:ssformat rounded to the beginning of the month -
Week on the user's computer — date and time on the user's computer in
YYYY-MM-DDHH:mm:ssformat rounded to the beginning of the week -
Hour on the user's computer — date and time on the user's computer in
YYYY-MM-DDHH:mm:ssformat rounded to the beginning of the hour -
Start of decaminute on the user's computer — date and time on the user's computer in
YYYY-MM-DDHH:mm:ssformat rounded to the beginning of the 10-minute interval -
Minute on the user's computer — date and time on the user's computer in
YYYY-MM-DDHH:mm:ssformat rounded to the beginning of the minute -
Date and time on the user's computer — date and time on the user's computer in
YYYY-MM-DDHH:mm:ssformat
Date/time fragment
-
Year on the user's computer
-
Month on the user's computer
-
Day of month on the user's computer
-
Day of week on the user's computer
-
Hour on the user's computer in
HH:00format -
Minute on the user's computer
-
Decaminute on the user's computer
-
Hour and minute on the user's computer
HistoryType
Description
Whether this is the user's first session
Sessions in history
Number of the user's sessions during the entire data collection period, interval
Total sessions
Number of the user's sessions during the entire data collection period
Days since the first session
Number of days since the user's first session, interval
Days since first session (detailed)
Number of days since the user's first session
Days since the last session
Number of days since the user's penultimate session, interval
Time since the previous session
Number of days since the user's penultimate session
Frequency
Average number of days between sessions, interval
Frequency (detailed)
Average number of days between sessions
Date and time of the first session
-
Date of the first session — date of the user's first session in
YYYY-MM-DDformat -
Date of the first session (interval) — date interval with parametrization of the interval size
With set accuracy
-
Year of the first session — date of the user's first session in
YYYY-MM-DDformat rounded to the beginning of the year -
Quarter of the first session — date of the user's first session in
YYYY-MM-DDformat rounded to the beginning of the quarter -
Month of the first session — date of the user's first session in
YYYY-MM-DDformat rounded to the beginning of the month -
Week of the first session — date of the user's first session in
YYYY-MM-DDformat rounded to the beginning of the week (Monday) -
Hour of the first session — date and time of the user's first session in
YYYY-MM-DDHH:mm:ssformat rounded to the beginning of the hour -
Start of decaminute of the first session — date and time of the user's first session in
YYYY-MM-DDHH:mm:ssformat rounded to the beginning of the 10-minute interval -
Minute of the first session — date and time of the user's first session in
YYYY-MM-DDHH:mm:ssformat rounded to the beginning of the minute -
Date and time of the first session — date and time of the user's first session in
YYYY-MM-DDHH:mm:ssformat
Date/time fragment
-
Year of the first session
-
Month of the first session
-
Day of month of the first session
-
Day of week of the first session
-
Hour of the first session — time — beginning of the hour period in
HH:MMformat -
Decaminute of the first session
-
Minute of the first session
-
Hour and minute of the first session
Date and time of the previous session
-
Date of the previous session — date of the user's previous session in
YYYY-MM-DDformat -
Date of the previous session (interval) — date interval with parametrization of the interval size
With set accuracy
-
Year of the penultimate session — date and time of the user's penultimate session in
YYYY-MM-DDHH:mm:ssformat rounded to the beginning of the year -
Quarter of the penultimate session — date and time of the user's penultimate session in
YYYY-MM-DDHH:mm:ssformat rounded to the beginning of the quarter -
Month of the penultimate session — date and time of the user's penultimate session in
YYYY-MM-DDHH:mm:ssformat rounded to the beginning of the month -
Week of the penultimate session — date and time of the user's penultimate session in
YYYY-MM-DDHH:mm:ssformat rounded to the beginning of the week
Date/time fragment
-
Year of the previous session
-
Month of the previous session
-
Day of month of the previous session
-
Day of week of the previous session
AudienceType
Description
Gender
The user's gender. Possible values: male or female
Age
User's age, interval
Interest category
Category of users' commercial interests
Interest category, level 1
Category of users' commercial interests
Interest category, level 2
Category of users' commercial interests
Interest category, level 3
Category of users' commercial interests
ClientID
Site user ID assigned by Yandex Metrica
User parameter, level 1
First nesting level of user parameters
User parameter, level 2
Second nesting level of user parameters
User parameter, level 3
Third nesting level of user parameters
User parameter, level 4
Fourth nesting level of user parameters
User parameter, level 5
Fifth nesting level of user parameters
User's UserID
Geography
-
Continent — continents where site users are located
-
Country — countries where site users are located
-
District — districts where site users are located
-
Region — regions where site users are located
-
City — cities where site users are located
-
City size — city size by population
-
Browser language
-
Browser country
-
Time zone on the user's computer
TechnologyType
Description
IP address
The user's IPv4/IPv6 address with the last 1 or 8 bytes respectively reset to zero. For example,
77.88.21.0/2001:db8:85a3: :Device
-
Device type — type of device for the session. Possible values:
desktop,mobile,tablet,tv -
Device manufacturer
-
Device model
Operating systems
-
Group of operating systems
-
Operating system (detailed)
Browser
-
Browser — user’s browser
-
Browser version — browser name and version
-
Full browser version — browser and its full version
Browser technologies
-
Cookie present
-
Third-party cookies
-
JavaScript
-
Presence of ad blockers
Engine
-
Browser engine — user's browser engine. For example,
WebKit -
Browser engine major version — first number in the user's browser engine version
-
Browser engine minor version — second number in the user's browser engine version
-
Browser engine build version — third number (usually the build number) in the user's browser engine version
-
Browser engine revision version — fourth number (usually the revision number) in the user's browser engine version
Screen
-
Aspect ratio — ratio of screen width to height. For example, 16:9
-
Color depth — screen color depth in bytes. For example, 24
-
Screen orientation — screen orientation. Possible values:
landscape,portrait
Logical sizes
-
Resolution — screen resolution. For example, 1920 × 1080.
-
Logical width — logical screen width
-
Logical height — logical screen height
Physical sizes
-
Actual resolution — actual screen resolution based on
device pixel ratiodata. For example, 1920 × 1080. -
Physical width — physical screen width based on
device pixel ratiodata -
Physical height — physical screen height based on
device pixel ratiodata
Window sizes
-
Window size — client browser window size. For example, 1920 × 1080.
-
Window width — client browser window width
-
Window height — client browser window height
E-commerceType
Description
Product ID
Product name
Brand
Product variant
Product list
Product position
Product category, level 1
Product category, level 2
Product category, level 3
Product category, level 4
Product category, level 5
Product promo code
Discount percentage
Purchase ID
Purchase promo code
Number of purchases in session
Number of product views in session
URL of product event
Promo campaigns
-
Promo campaign ID
-
Promo campaign name
-
Banner name
-
Banner location
-
Banner position
-
URL of promo campaign event
Content analyticsType
Description
Article title
Category, level 1
Category, level 2
Date of publication
Content URL
Scroll depth
Full reads
Title of the referring article
Article views with recirculation
Author
Topic
Content length
Traffic source
Click source (detailed)
Name of click source. For example, for clicks on site links, this is a specific domain.
Page format
Display options: mobile and full version, Turbo pages, Turbo service, AMP, Facebook Instant Article. Any pageview on a mobile device is considered a mobile version
Metrics
Basic metricsType
Description
Sessions
Total number of sessions
Pageviews
Number of pageviews on the site in the reporting period
Pageviews (obsolete)
Obsolete version of the
ym:s:paramsLevel1metric. Was used prior to the changes in the calculation algorithmUsers
Number of unique users
Cross-device users
Number of unique users, taking into account all devices
Conversion metricsType
Description
Conversion rate — number of conversions as a percentage of the total number of sessions
-
Conversion: "3+ hits"
-
Conversion: "То blog"
-
Conversion: "Auto-goal: provided contact information"
-
Conversion: "Еcommerce: purchase"
-
Conversion: "View features"
-
Conversion: "Promo: Button Try live demo main"
-
Conversion: "12345"
-
Conversion: "Ecommerce: add to cart"
-
Conversion: "visited site"
-
Conversion: "form submission"
-
Conversion: "Jivo auto-goal: customer opened chat"
-
Conversion: "Jivo auto-goal: auto-invite to chat"
-
Conversion: "Auto-goal: file download"
-
Conversion: "Auto-goal: click to social network"
-
Conversion: "Auto-goal: open messenger"
-
Conversion: "Marquiz auto-goal: quiz launched"
-
Conversion: "Auto-goal: click on email"
-
Conversion: "Auto-goal: add to favorites"
-
Conversion: "Auto-goal: submit an application form"
-
Conversion: "Auto-goal: add to cart"
-
Conversion: "Auto-goal: site search"
-
Conversion: "Auto-goal: start to check out"
-
Conversion: "Jivo auto-goal: offline message"
-
Conversion: "Auto-goal: enter contact information"
-
Conversion: "Auto-goal: successful order"
-
Conversion: "Marquiz auto-goal: “Thank You” page"
-
Conversion: "Auto-goal: request form opened"
-
Conversion: "Yandex Business Auto-goal: request"
-
Conversion: "Auto-goal: click on phone number"
-
Conversion: "Auto-goal: sent contact information"
-
Conversion: "Yandex Business Auto-goal: callback"
-
Conversion: "Yandex Business Auto-goal: request"
Conversions per user — average number of conversions per unique converted user
-
Conversions per user: "3+ hits"
-
Conversions per user: "То blog"
-
Conversions per user: "Auto-goal: provided contact information"
-
Conversions per user: "Ecommerce: purchase"
-
Conversions per user: "View features"
-
Conversions per user: "Promo: Button Try live demo main"
-
Conversions per user: "12345"
-
Conversions per user: "Ecommerce: add to cart"
-
Conversions per user: "visited site"
-
Conversions per user: "form submission"
-
Conversions per user: "Jivo auto-goal: customer opened chat"
-
Conversions per user: "Jivo auto-goal: auto-invite to chat"
-
Conversions per user: "Auto-goal: file download"
-
Conversions per user: "Auto-goal: click to social network"
-
Conversions per user: "Auto-goal: open messenger"
-
Conversions per user: "Marquiz auto-goal: quiz launched"
-
Conversions per user: "Auto-goal: click on email"
-
Conversions per user: "Auto-goal: add to favorites"
-
Conversions per user: "Auto-goal: submit an application form"
-
Conversions per user: "Auto-goal: add to cart"
-
Conversions per user: "Auto-goal: site search"
-
Conversions per user: "Auto-goal: start to check out"
-
Conversions per user: "Jivo auto-goal: offline message"
-
Conversions per user: "Auto-goal: enter contact information"
-
Conversions per user: "Auto-goal: successful order"
-
Conversions per user: "Marquiz auto-goal: “Thank You” page"
-
Conversions per user: "Auto-goal: request form opened"
-
Conversions per user: "Yandex Business Auto-goal: request"
-
Conversions per user: "Auto-goal: click on phone number"
-
Conversions per user: "Auto-goal: sent contact information"
-
Conversions per user: "Yandex Business Auto-goal: callback"
-
Conversions per user: "Yandex Business Auto-goal: request"
Goals reached — number of conversions in all sessions
-
Goals reached: "3+ hits"
-
Goals reached: "То blog"
-
Goals reached: "Auto-goal: provided contact information"
-
Goals reached: "Ecommerce: purchase"
-
Goals reached: "View features"
-
Goals reached: "Promo: Button Try live demo main"
-
Goals reached: "12345"
-
Goals reached: "Ecommerce: add to cart"
-
Goals reached: "visited site"
-
Goals reached: "form submission"
-
Goals reached: "Jivo auto-goal: customer opened chat"
-
Goals reached: "Jivo auto-goal: auto-invite to chat"
-
Goals reached: "Auto-goal: file download"
-
Goals reached: "Auto-goal: click to social network"
-
Goals reached: "Auto-goal: open messenger"
-
Goals reached: "Marquiz auto-goal: quiz launched"
-
Goals reached: "Auto-goal: click on email"
-
Goals reached: "Auto-goal: add to favorites"
-
Goals reached: "Auto-goal: submit an application form"
-
Goals reached: "Auto-goal: add to cart"
-
Goals reached: "Auto-goal: site search"
-
Goals reached: "Auto-goal: start to check out"
-
Goals reached: "Jivo auto-goal: offline message"
-
Goals reached: "Auto-goal: enter contact information"
-
Goals reached: "Auto-goal: successful order"
-
Goals reached: "Marquiz auto-goal: “Thank You” page"
-
Goals reached: "Auto-goal: request form opened"
-
Goals reached: "Yandex Business Auto-goal: request"
-
Goals reached: "Auto-goal: click on phone number"
-
Goals reached: "Auto-goal: sent contact information"
-
Goals reached: "Yandex Business Auto-goal: callback"
-
Goals reached: "Yandex Business Auto-goal: request"
Revenue by goal — revenue is calculated based on the
priceororder_pricesession parameter fromgoalParams-
Revenue by goal: "3+ hits"
-
Revenue by goal: "То blog"
-
Revenue by goal: "Auto-goal: provided contact information"
-
Revenue by goal: "Ecommerce: purchase"
-
Revenue by goal: "View features"
-
Revenue by goal: "Promo: Button Try live demo main"
-
Revenue by goal: "12345"
-
Revenue by goal: "Ecommerce: add to cart"
-
Revenue by goal: "visited site"
-
Revenue by goal: "form submission"
-
Revenue by goal: "Jivo auto-goal: customer opened chat"
-
Revenue by goal: "Jivo auto-goal: auto-invite to chat"
-
Revenue by goal: "Auto-goal: file download"
-
Revenue by goal: "Auto-goal: click to social network"
-
Revenue by goal: "Auto-goal: open messenger"
-
Revenue by goal: "Marquiz auto-goal: quiz launched"
-
Revenue by goal: "Auto-goal: click on email"
-
Revenue by goal: "Auto-goal: add to favorites"
-
Revenue by goal: "Auto-goal: submit an application form"
-
Revenue by goal: "Auto-goal: add to cart"
-
Revenue by goal: "Auto-goal: site search"
-
Revenue by goal: "Auto-goal: start to check out"
-
Revenue by goal: "Jivo auto-goal: offline message"
-
Revenue by goal: "Auto-goal: enter contact information"
-
Revenue by goal: "Auto-goal: successful order"
-
Revenue by goal: "Marquiz auto-goal: “Thank You” page"
-
Revenue by goal: "Auto-goal: request form opened"
-
Revenue by goal: "Yandex Business Auto-goal: request"
-
Revenue by goal: "Auto-goal: click on phone number"
-
Revenue by goal: "Auto-goal: sent contact information"
-
Revenue by goal: "Yandex Business Auto-goal: callback"
-
Revenue by goal: "Yandex Business Auto-goal: request"
User conversion rate — share of converted sessions among the total number of unique users
-
User conversion rate: "3+ hits"
-
User conversion rate: "То blog"
-
User conversion rate: "Auto-goal: provided contact information"
-
User conversion rate: "Ecommerce: purchase"
-
User conversion rate: "View features"
-
User conversion rate: "Promo: Button Try live demo main"
-
User conversion rate: "12345"
-
User conversion rate: "Ecommerce: add to cart"
-
User conversion rate: "visited site"
-
User conversion rate: "form submission"
-
User conversion rate: "Jivo auto-goal: customer opened chat"
-
User conversion rate: "Jivo auto-goal: auto-invite to chat"
-
User conversion rate: "Auto-goal: file download"
-
User conversion rate: "Auto-goal: click to social network"
-
User conversion rate: "Auto-goal: open messenger"
-
User conversion rate: "Marquiz auto-goal: quiz launched"
-
User conversion rate: "Auto-goal: click on email"
-
User conversion rate: "Auto-goal: add to favorites"
-
User conversion rate: "Auto-goal: submit an application form"
-
User conversion rate: "Auto-goal: add to cart"
-
User conversion rate: "Auto-goal: site search"
-
User conversion rate: "Auto-goal: start to check out"
-
User conversion rate: "Jivo auto-goal: offline message"
-
User conversion rate: "Auto-goal: enter contact information"
-
User conversion rate: "Auto-goal: successful order"
-
User conversion rate: "Marquiz auto-goal: “Thank You” page"
-
User conversion rate: "Auto-goal: request form opened"
-
User conversion rate: "Yandex Business Auto-goal: request"
-
User conversion rate: "Auto-goal: click on phone number"
-
User conversion rate: "Auto-goal: sent contact information"
-
User conversion rate: "Yandex Business Auto-goal: callback"
-
User conversion rate: "Yandex Business Auto-goal: request"
Converted users — number of unique users that reached goals
-
Converted users: "3+ hits"
-
Converted users: "То blog"
-
Converted users: "Auto-goal: provided contact information"
-
Converted users: "Ecommerce: purchase"
-
Converted users: "View features"
-
Converted users: "Promo: Button Try live demo main"
-
Converted users: "12345"
-
Converted users: "Ecommerce: add to cart"
-
Converted users: "visited site"
-
Converted users: "form submission"
-
Converted users: "Jivo auto-goal: customer opened chat"
-
Converted users: "Jivo auto-goal: auto-invite to chat"
-
Converted users: "Auto-goal: file downloads"
-
Converted users: "Auto-goal: click to social network"
-
Converted users: "Auto-goal: open messenger"
-
Converted users: "Marquiz auto-goal: quiz launched"
-
Converted users: "Auto-goal: click on email"
-
Converted users: "Auto-goal: add to favorites"
-
Converted users: "Auto-goal: submit an application form"
-
Converted users: "Auto-goal: add to cart"
-
Converted users: "Auto-goal: site search"
-
Converted users: "Auto-goal: start to check out"
-
Converted users: "Jivo auto-goal: offline message"
-
Converted users: "Auto-goal: enter contact information"
-
Converted users: "Auto-goal: successful order"
-
Converted users: "Marquiz auto-goal: “Thank You” page"
-
Converted users: "Auto-goal: request form opened"
-
Converted users: "Yandex Business Auto-goal: request"
-
Converted users: "Auto-goal: click on phone number"
-
Converted users: "Auto-goal: sent contact information"
-
Converted users: "Yandex Business Auto-goal: callback"
-
Converted users: "Yandex Business Auto-goal: request"
Converted sessions — number of converted sessions
-
Converted sessions: "3+ hits"
-
Converted sessions: "То blog"
-
Converted sessions: "Auto-goal: provided contact information"
-
Converted sessions: "Ecommerce: purchase"
-
Converted sessions: "View features"
-
Converted sessions: "Promo: Button Try live demo main"
-
Converted sessions: "12345"
-
Converted sessions: "Ecommerce: add to cart"
-
Converted sessions: "visited site"
-
Converted sessions: "form submission"
-
Converted sessions: "Jivo auto-goal: customer opened chat"
-
Converted sessions: "Jivo auto-goal: auto-invite to chat"
-
Converted sessions: "Auto-goal: file download"
-
Converted sessions: "Auto-goal: click to social network"
-
Converted sessions: "Auto-goal: open messenger"
-
Converted sessions: "Marquiz auto-goal: quiz launched"
-
Converted sessions: "Auto-goal: click on email"
-
Converted sessions: "Auto-goal: add to favorites"
-
Converted sessions: "Auto-goal: submit an application form"
-
Converted sessions: "Auto-goal: add to cart"
-
Converted sessions: "Auto-goal: site search"
-
Converted sessions: "Auto-goal: start to check out"
-
Converted sessions: "Jivo auto-goal: offline message"
-
Converted sessions: "Auto-goal: enter contact information"
-
Converted sessions: "Auto-goal: successful order"
-
Converted sessions: "Marquiz auto-goal: “Thank You” page"
-
Converted sessions: "Auto-goal: request form opened"
-
Converted sessions: "Yandex Business Auto-goal: request"
-
Converted sessions: "Auto-goal: click on phone number"
-
Converted sessions: "Auto-goal: sent contact information"
-
Converted sessions: "Yandex Business Auto-goal: callback"
-
Converted sessions: "Yandex Business Auto-goal: request"
BehaviorType
Description
Bounces
Share of sessions with only one pageview that lasted less than 15 seconds
Page depth
Average number of pageviews in sessions. Calculated as a ratio of pageviews to sessions
Page depth (obsolete)
Obsolete version of the
ym:s:pageDepthmetric. Was used prior to the changes in the calculation algorithmTime on site
Average session duration in seconds (ss) or minutes:seconds (mm:ss) format
Bounces (obsolete)
Obsolete version of the
ym:s:bounceRatemetric. Was used prior to the changes in the calculation algorithmTime on site (obsolete)
Obsolete version of the
ym:s:avgVisitDurationSecondsmetric. Was used prior to the changes in the calculation algorithmSessions per day
Sessions per hour
Sessions per minute
Robot sessions
Robot sessions identified by behavioral factors. Robots disguise themselves as real users by mimicking their behavior, but Yandex Metrica can detect them
Robot activity
Share of robot sessions identified by behavioral factors. Robots disguise themselves as real users by mimicking their behavior, but Yandex Metrica can detect them
Conversions (any goals)
-
Conversion rate by any goal — conversion rate for any goal
-
All goals reached — number of conversions for any goal
Favorite goals
-
Goal conversion — Share of converted sessions with favorite goals
-
Conversions for favorite goals
-
Sessions with favorite goals
-
Revenue across favorite goals — Summed across all favorite goals
-
Users with favorite goals
-
Conversion rate across favorite goals — share of users who have achieved favorite goals out of the total number of unique users
-
Conversions for favorite goals per user
-
Average revenue per session across favorite goals
Session parametersType
Description
Number of session parameters
Number of times the session featured a session parameter
Sum of session parameters
Sum of session parameter values. Calculated if session parameter values are represented numerically
Average of session parameters
Average value of a session parameter. Calculated if the session parameter value is represented numerically
User parametersType
Description
Number of user parameters
Number of times the session featured a user parameter
Sum of user parameters
Sum of user parameter values. Calculated if user parameter values are represented numerically
Average of user parameters
Average value of a user parameter. Calculated if the user parameter value is represented numerically
HistoryType
Description
Recency
-
Percentage of new users — percentage of unique site users with sessions in the reporting period whose activity included their very first site session since the beginning of data collection
-
New users — number of new users
-
Percentage of new users' sessions — share of new users' sessions
-
Recency less than one day — share of sessions by users known for less than one day
-
Recency 1‑7 days — share of sessions by users known for 1–7 days
-
Recency 8‑31 days — share of sessions by users known for 8–31 days
-
Recency 32‑90 days — share of sessions by users known for 32–90 days
-
Recency 91-365 days — share of sessions by users known for 91–365 days
-
Recency more than 365 days — share of sessions by users known for more than 365 days
Sessions in history
-
1 user session — share of sessions by users with one session (user's first session)
-
2-3 user sessions — share of sessions by users with 2–3 sessions
-
4-7 user sessions — share of sessions by users with 4–7 sessions
-
8-31 user sessions — share of sessions by users with 8–31 sessions
-
More than 32 user sessions — share of sessions by users who had more than 32 sessions
Frequency
-
Frequency 1 day — share of sessions by users with a session frequency of once per day. This includes users who had more than two sessions that occurred on different days
-
Frequency 2-7 days — share of sessions by users with a session frequency of once every 2–7 days. This includes users who have more than two sessions and on more than 1 day
-
Frequency 8-31 days — share of sessions by users with a session frequency of once every 8–31 days. This includes users who have more than two sessions and on more than 1 day
-
Frequency more than 31 days — share of sessions by users with a session frequency of once every 31+ days. This includes users who had more than two sessions that occurred on different days
Days since the last session
-
Returned: 1 day — share of sessions by users who returned to the site after 1 day
-
Returned: 2‑7 days — share of sessions by users who returned to the site after 2–7 days
-
Returned: 8-31 days — share of sessions by users who returned to the site after 8–31 days
-
Returned: 32-90 days — share of sessions by users who returned to the site after 32–90 days
-
Returned: 91-365 days — share of sessions by users who returned to the site after 91–365 days
-
Returned: more than 365 days — share of sessions by users who returned to the site after more than 365 days
Loyalty
-
Days between sessions — average number of days between the user's sessions
-
Days since the first session — average time elapsed since the first session in days
-
Days since the previous session — average time elapsed since the penultimate session in days
AudienceType
Description
Gender
-
Share of men.
-
Share of women
Age
-
Less than 18 years old — share of sessions by users younger than 18 years old
-
Age 18-24 — share of sessions by users between 18 and 24 years old
-
Age 25-34 — share of sessions by users between 25 and 34 years old
-
Age 35-44 — share of sessions by users between 35 and 44 years old
-
Age 45-54 — share of sessions by users between 45 and 54 years old
-
Age 55+ — share of sessions by users aged 55+
TechnologyType
Description
Cookie support
Share of sessions and hits with cookies enabled
Third-party cookie support
Share of sessions and hits with third-party cookies enabled
JavaScript support
Share of sessions and hits with JavaScript support
Mobility
Share of sessions and hits made with mobile devices
Ad blocking
Share of sessions with ad blockers
E-commerceType
Description
Views of products in the list
Number of times a product in the list was viewed, total for all sessions
Users who viewed the product in the list
Number of users who viewed information in the list about at least one product
Share of users who viewed the product in the list
The ratio of the number of unique users who viewed information in the list about at least one product to the total number of users
Product clicks
Number of clicks on products, total for all sessions
Users who clicked the product
Number of users who clicked on at least one product
Share of users who clicked a product
The ratio of the number of unique users who clicked at least one product to the total number of users
Item views
Number of times pages with product information were viewed, total for all sessions
Users who viewed the product
Number of users who viewed information about at least one product
Share of users who viewed the product
The ratio of the number of unique users who viewed information about at least one product to the total number of users
Items added to basket
Number of items removed from the shopping cart, total for all sessions
Items removed from basket
Number of items removed from the shopping cart, total for all sessions
Price of items added to the shopping cart
Price of products added to the shopping cart, total for all sessions
Price of items removed from the shopping cart
Price of products removed from the shopping cart, total for all sessions
Users who added a product to the shopping cart
Number of users who added at least one product to the shopping cart, total for all sessions
Users who removed a product from the shopping cart
Number of users who removed at least one product from the shopping cart, total for all sessions
Share of users who added the product to the shopping cart
The ratio of the number of unique users who added at least one product to the shopping cart to the total number of users
Share of users who removed the product from the shopping cart
The ratio of the number of unique users who removed at least one product from the shopping cart to the total number of users
Items purchased
Number of purchased product units, total for all sessions
Cost of items purchased
Cost of all purchased products, total for all sessions
Users who purchased a product
Number of users who purchased at least one product, total for all sessions
Share of users who placed an order
The ratio of the number of unique users who removed at least one product from the shopping cart to the total number of users
Number of purchases.
Revenue
Total revenue from all sessions
Average revenue per session
Average revenue from purchase
Banner views
Number of banner views, total for all sessions
Users who viewed the banner
Number of users who viewed at least one banner
Share of users who viewed the banner
The ratio of the number of unique users who viewed at least one banner to the total number of users
Banner clicks
Number of clicks on the banner, total for all sessions
Users who clicked the banner
Number of users who clicked at least one banner
Share of users who clicked the banner
The ratio of the number of unique users who clicked at least one banner to the total number of users
OtherType
Description
Affinity index (old version)
The ratio of the share of users with the specified interest on this site to the average share of users with this interest on all internet sites. Only allowed when using the "Category of interests" dimension
Affinity index
The ratio of the share of users with the specified interest on this site to the average share of users with this interest on all internet sites. Only allowed when using the "Category of interests" dimension
GCLID percentage
Share of sessions with the GCLID tag
Content analyticsType
Description
Total reading time
Total time all site users spent reading the article (or articles) in the selected period
Time on content
Average time users who viewed articles spent on reading one article
Article views
Total article views. Each article view on a page counts
Article views per day
The ratio of the number of article views to the number of days in the selected period
Article views per hour
The ratio of the number of article views to the number of hours in the selected period
Article views per minute
The ratio of the number of article views to the number of minutes in the selected period
Users with article views
All site users who viewed at least one article
Recirculating users
Number of users who navigated from this article to other site content
Recirculation
Share of users who navigated from this article to other site content
Article views with full scrolls
Number of views where users scrolled the article to the end
Share of full scrolls
Share of views where users scrolled the article to the end
Share of full reads
Number of views where users read the article to the end
Share of full reads
Share of full article reads relative to articles with full scrolls. Read depth shows what percentage of users have scrolled through the content to the end and read it at a speed of no more than 60 characters per second
Articles viewed on mobile
Article views from mobile devices: phones and tablets
Share of articles viewed on mobile
Share of article views from mobile devices: phones and tablets
-
3. Segmentation
- You can use segmentation to filter report data based on the specified conditions. For example, you can take the Sources, Summary report data and get traffic only from tablet users. For more information, see Data segmentation.
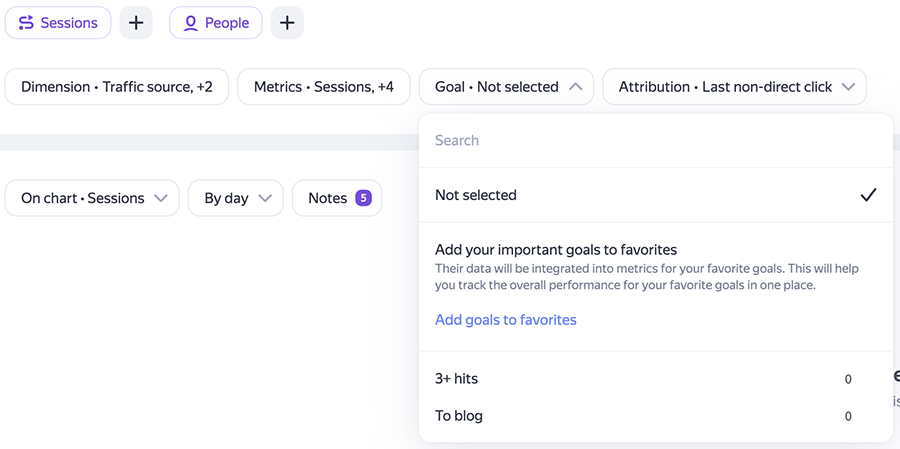
4. Selecting a goal
-
When you select a previously created goal from the list, report data is updated to reflect this goal. For more information, see What are goals? Types of goals.
5. Chart types
-
By default, data is shown as a line chart. It represents how your metrics change over time. You can choose a type of chart that's appropriate for your selected report:
- Line chart and Line chart stacked — show changes to the absolute values of measured variables over time.
- Bar chart and Bar chart stacked — shows the change in the ratio of variables over time.
- Bar chart by category — shows the change in the ratio of variables.
- Pie chart — shows the distribution of variables by groups.
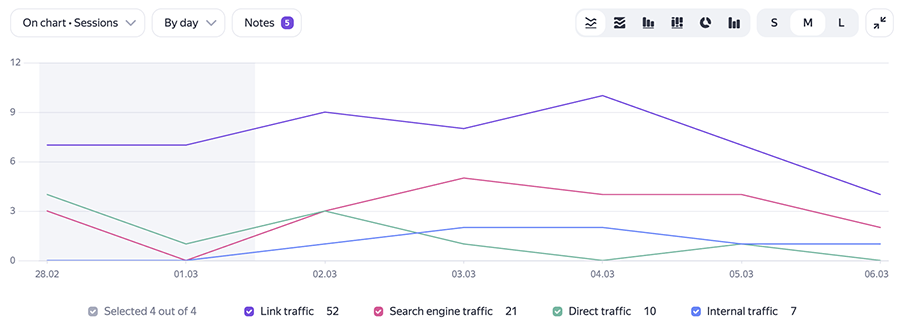
6. Data broken down by time
- On line charts, data is broken down by intervals. The granularity automatically adjusts to the size of the selected period. You can refine the time period to minutes, hours, days, weeks and months.
7. Displaying data on a chart
- By default, charts show values of the metric by which data was sorted. If you need the chart to show any other metric that is available in the report, click On chart.
8. Displaying data in a table
-
All indicators are grouped according to certain characteristics (dimensions: by operating system, its version, and so on)
Use the toggle above the table to choose how to display metrics: in linear or tree view mode.
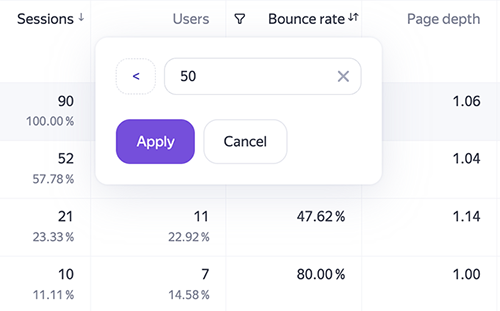
9. Refining numeric metrics
-
Yandex Metrica lets you set a numeric restriction for showing statistics. For example, to show information on bounces with a value higher than 50%. To filter the values, click "<". In this case, the report will show only the rows (dimension) that have metric values matching the condition you set.
10. Sample
-
If forming a report requires a large quantity of data, it can take a long time to collect the information. In order to generate the report faster, the service can use just part of the data (for example, 10%).
To change this value, go to the report page in Yandex Metrica and click Settings → Sample on the right above the chart. Choose a sample type:
-
Automatic: The sample size is determined automatically to build the report faster while preserving the distribution and trends of metric changes.
-
Maximum: Determines the maximum possible sample size under the current load. To increase the sample size, reduce the period or get Yandex Metrica Pro.
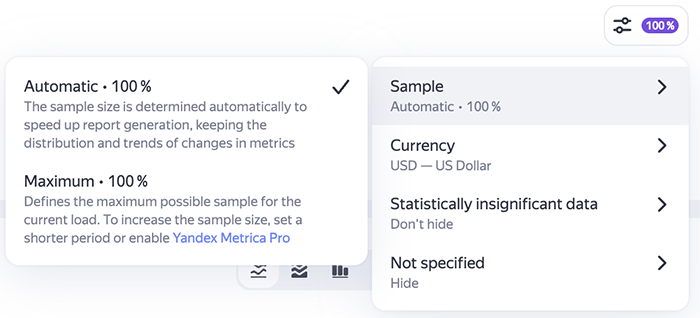
For more information, see Sampling.
When you switch to a different report, this setting is saved. Information about this appears at the bottom of the screen. You can leave it, or reset it.
-
11. Attribution
- These help correctly identify the source of a referral, in order to calculate the conversion rate for a created goal. The element is available only if you're using dimension by source without a set attribution. For more information, see Attribution models.
12. Notes in charts
-
The comments help you track important events and see how they are related to changes in site statistics. You can create your own notes or use the Yandex Metrica preset notes. The preset notes include:
Icon in the interface
Group
Description
Holidays
Federal holidays are shown if Yandex Metrica detected the region for the tag.
Sometimes traffic fluctuates over long holidays. For instance, traffic to travel sites increases before extended holidays.
For details, see Notes on charts.
13. Data accuracy
-
Metrica provides many numbers on all the possible aspects of how your site works, and all these numbers are accurate in terms of how they are calculated. But this is not always true in terms of site analysis. For example, if a single user visited the site and viewed a page for 20 minutes, it is formally true to say that the average session length is 20 minutes. However, common sense tells us otherwise: we can’t make conclusions about a site based on a single session.
The service allows you to hide report rows that contain this type of incorrect information. For more information, see Statistical accuracy of data.
14. Sorting data by metric
- By default, report data is sorted by the first metric (for example, by sessions). To change the sorting, click the metric that is more important to you.
15. Currency
-
The currency is displayed if the report contains information about money, for example, e-commerce revenue or advertising expenses. The currency is also displayed if you pass Revenue by goal.
To change the currency, go to the report page in Yandex Metrica and click Settings → Currency on the right above the chart.
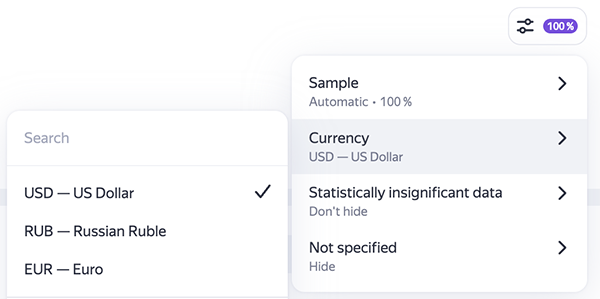
The list shows the currencies of data sent to Yandex Metrica. When you select a currency, the values of the revenue and expense metrics are recalculated according to the conversion rate preceding the date of the transaction.
Currency conversions use the exchange rate provided by more than 15 sources, including the European Central Bank. Conversion to EUR and RUB currencies is relative to USD.
Actions with reports
Saving a report
-
To save a report:
- Click → Save as.
- Enter a report name.
- Choose where to save the report: to your account or tag.
You can use the saved report for all Yandex Metrica tags that you have access to. However, some of the report settings may not be applied. For example, a goal set in the report is ignored if it’s not linked to the current tag in the settings.
The report is visible only to the username that saved it. Other users with access to the tag do not see changes in the report.
Note
Reports saved with dimensions and metrics from the Monetization group can't be used for tags without the Monetization report group.
Resetting parameters
-
To reset parameters:
- Click → Save as.
- Select Reset parameters.
On parameter reset, all the settings (segmentations, metrics, dimensions) are reverted to the current report's defaults. The reporting period persists.
Export a report to a convenient format
- To export the obtained information in PDF, XLSX, or CSV formats, display the data table as a linear list and click the button. The first 100,000 lines of the report are put in a file of the selected format.
Rename a report
-
To rename a saved report:
- Click or the name of your saved report → Rename.
- In the window that opens, enter a new name and click Save report.
Delete a report
- To delete a saved report, click → Delete. You can’t restore a deleted report.
Note
Editing, creating, saving, renaming and deleting are all available if you are the owner of the Yandex Metrica tag, or you have representative access or editing access.
Statistics depersonalization
Yandex Metrica protects users' privacy and ensures that all collected information is depersonalized. To prevent the risk of deanonymization, Yandex Metrica doesn’t reveal user data in full. This includes data that is calculated by Yandex algorithms, such as socio-demographics (gender, age), login page addresses, search queries, information about robots, and other data. Such information is only provided if there are more than 10 users in the sample. Yandex Metrica has consistently adhered to this rule for a long time, ensuring the privacy of its users.
Examples
-
Share of male users
Suppose you want to find out what percentage of users for a specific day were male. At the time the report was generated, the site was visited by 5 users (less than 10). In this case, the report will contain information about the total number of visitors for the day, but data on the number of male users will be unavailable.
Search queries that brought users to your website
Suppose you need to find out what search queries brought users from search results to a specific page on your website. If that page receives low traffic and you’re generating a report for a period of one month, the sample may include fewer than ten users. In this case, you can see the overall search traffic statistics, but not the search query data.
The privacy rule applies to dimensions, metrics, conditions when using segmentation, and other settings. When a report or widget with this kind of information is viewed, Yandex Metrica displays a message about disabling data granularity for sessions and users.
With a sample size of fewer than ten users, application of report parameters in combination with robot filtering creates a risk of user deanonymization. To prevent this, Yandex Metrica doesn’t allow refining data down to individual sessions and users. Note that your reports will still show all the information necessary for optimizing your website and ad campaigns.
How can I restore full data display in reports?
-
Try the following recommendations:
- Select a longer period or reduce the report detalization.
- Disable the last applied filter, dimension, or metric.
|
Useful links |
Online training |