E-commerce group reports
This group of reports lets you analyze data related to E-commerce.
To generate the reports, you must use the features of the service for calculating and analyzing E-commerce data. The first time you transmit data, reports will become available within a few hours.
The reports contain the following information:
|
Information |
Report |
|
Products and brands with the highest demand |
|
|
Site revenue and sources that provide the greatest revenue (such as search engines, advertising, or direct hits) |
|
|
Contents of orders, including items that were purchased on your website or just added to the basket |
|
|
Effectiveness of ad materials displayed on your website |
This information will help you:
- Adjust the ways you attract users, evaluate the effectiveness of advertising channels, and single out the most cost-effective ones.
- Analyze which brands of products users are viewing but not purchasing, and which categories of products are purchased most often.
- Determine seasonal interest in individual items, as well as identify the most popular categories and brands.
- Find out the number of items and revenue per order. For example, if the number of items per purchase is less than desired, you can offer deals on purchasing multiple items, and so on.
All reports (except the “Order Contents” report) support customization. For example, you can create goals to find out the number of orders and revenue from purchases that were made after viewing special offers on the website.
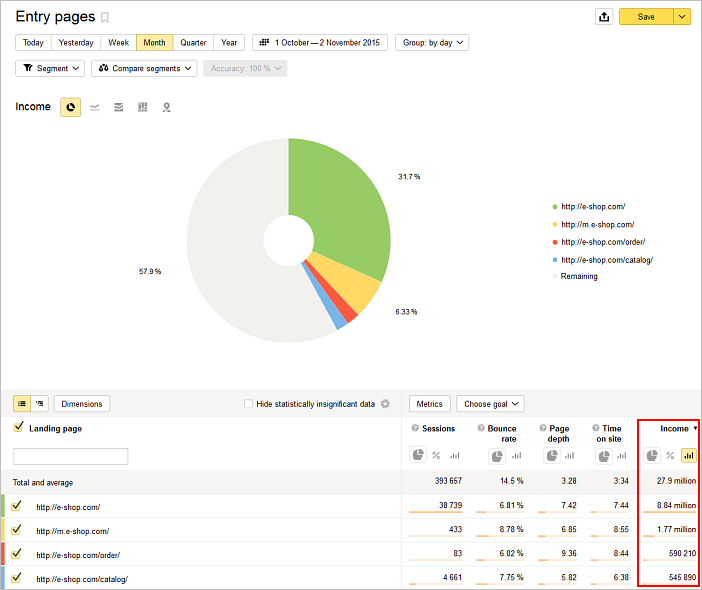
Metrics and the dimensions they are grouped in for E-commerce reports can be used in other Yandex Metrica reports. For example, you can determine which website pages were entry pages for sessions that brought the most revenue.
Questions and answers
Why all products aren’t reflected in reports
Your main site and Turbo site most likely have different tags. This is why all information about products on your Turbo site is sent to one tag, while your main site information is sent to another tag.
|
Useful links |
Online training |