How to view statistics in Yandex Metrica for mobile
Mobile Yandex Metrica tools are as similar as possible to the tools in the desktop version, but there are some differences when viewing statistics.
Setting up a report
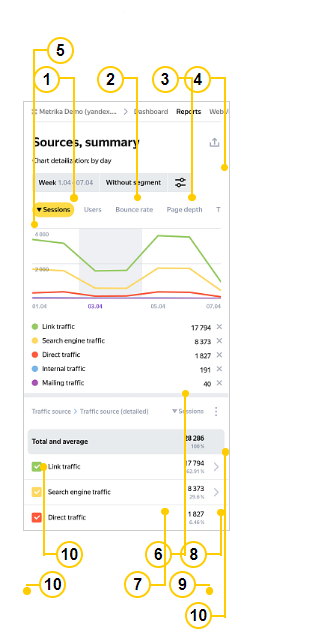
1. Selecting the period and data breakdown
-
You can select the period to build a report for.
The “Lines” and “Areas” graphs display data by time period. The default value is By day. You can set the time period to days, weeks, and months.
2. Selecting the segment
- You can select a segment that you saved before or a ready-made segment (offered by the service). You can create a segment in the desktop version. Segmentation in reports
3. Report parameters
- You can customize the chart type, sample, and select a goal. You can create a goal in the full version of Yandex Metrica.
4. Downloading data
- You can download report data, including graphs, in PDF format.
5. Selecting metrics
- Scroll through the list of metrics and select the one you want to base the report on. What are metrics?
6. Viewing data for a specific date
- Move the line between dates on the graph. Metric values change depending on the line position.
7. Sorting data by metric
- Tap a metric to sort the data by it.
8. Displaying data in a table
- Dimensions can be displayed as a linear or tree list.
9. Dimensions data breakdown
- Tap to expand the list of dimensions.
10. Showing data in charts
-
By default, a graph displays data for the first five dimensions in a table. To remove dimensions data from a graph, tap the icon under the graph next to the dimension or the colored icon () in the table. To display data, tap the colored icon in the table.
To hide a line on a graph, tap .
Working with Session Replay
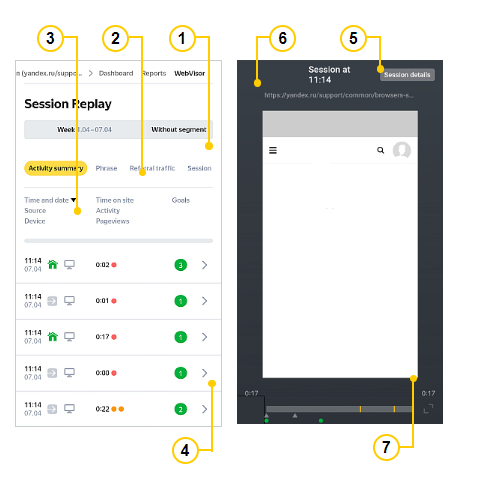
1. Selecting the segment
- You can select a segment that you saved before or a ready-made segment (offered by the service). You can create a segment in the full version of Yandex Metrica. Segmentation in reports
2. Filtering by a selected parameter
- Scroll through the list of parameters and select the one you want to view in the report.
3. Sorting data
- Tap a parameter to sort recordings by it.
4. View a session recording
- If Webvisor is enabled on the tag, you can view recordings in a version adapted for mobile devices. Turn the screen to horizontal position for better viewing.
5. Session information
-
You can find out:
- Which pages were viewed by a user during a session.
- Which goals were achieved.
- Information about the device type, operating system, and screen resolution.
- Which browser was used.
- The region where the user viewed the site from.
6. Going to the page
- You can go to the page where the session was recorded.
7. Full-screen mode
- Tap the icon to switch to full-screen mode.
|
Useful links |
Online training |