Yandex Metrica tag debugger
With the debugger, you can check what data is collected by a Yandex Metrica tag and whether it correctly collects data for:
To use the debugger, append the _ym_debug=2 parameter to the page URL in your browser's address bar and refresh the page:
http://example.com/?_ym_debug=2
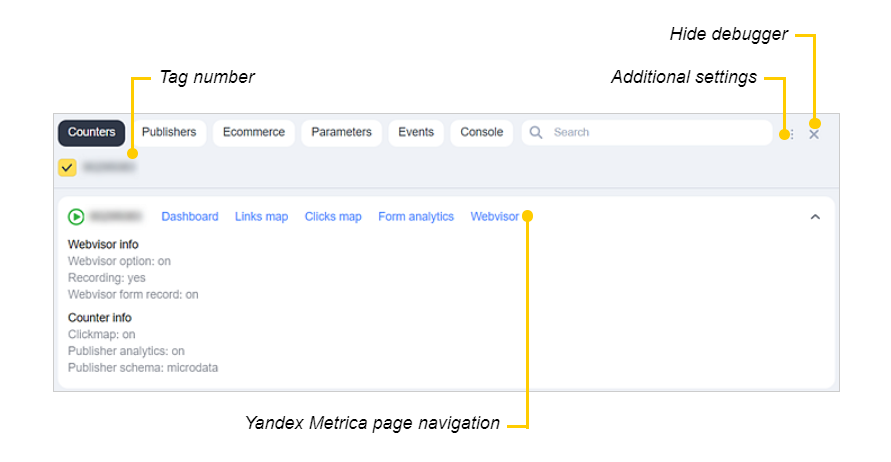
What data is available in the debug panel
Logging actions when using the debugger
When working with the debugger, you can track actions and their sequence. Yandex Metrica logs actions until the end of the session. This means you can log actions performed on different website pages. When you’re done, you can check different debugger tabs to analyze the collected data.
This option is available on the Console, Events, E-commerce, and Parameters tabs.
To save action logs, in the additional settings, select Preserve log. This option is disabled by default, which means that action logs aren’t saved when you refresh the page.
Why the debugger doesn’t work
|
Reason |
Recommendation |
|
The tag is blocked by the Adblock Plus extension, other scripts, or a firewall. |
You can check in the browser dashboard whether Adblock Plus or other scripts are enabled. |
|
The tag isn’t installed on the site or is installed incorrectly. For example, the CMS modified the tag code. |
Reinstall the tag or contact your CMS support. |
|
The |
Check your OS settings. |
|
Useful links |
Online training |