"Entry pages" report
The report contains statistics on the pages user sessions start from. The report only contains data on sessions that started from the pages specified there.
To view the report, go to Reports → Content → Landing pages.
An example of this report is available for the Yandex Metrica demo tag.
Ways to use this report
View pages user sessions start from
The report shows you which pages are visited first.
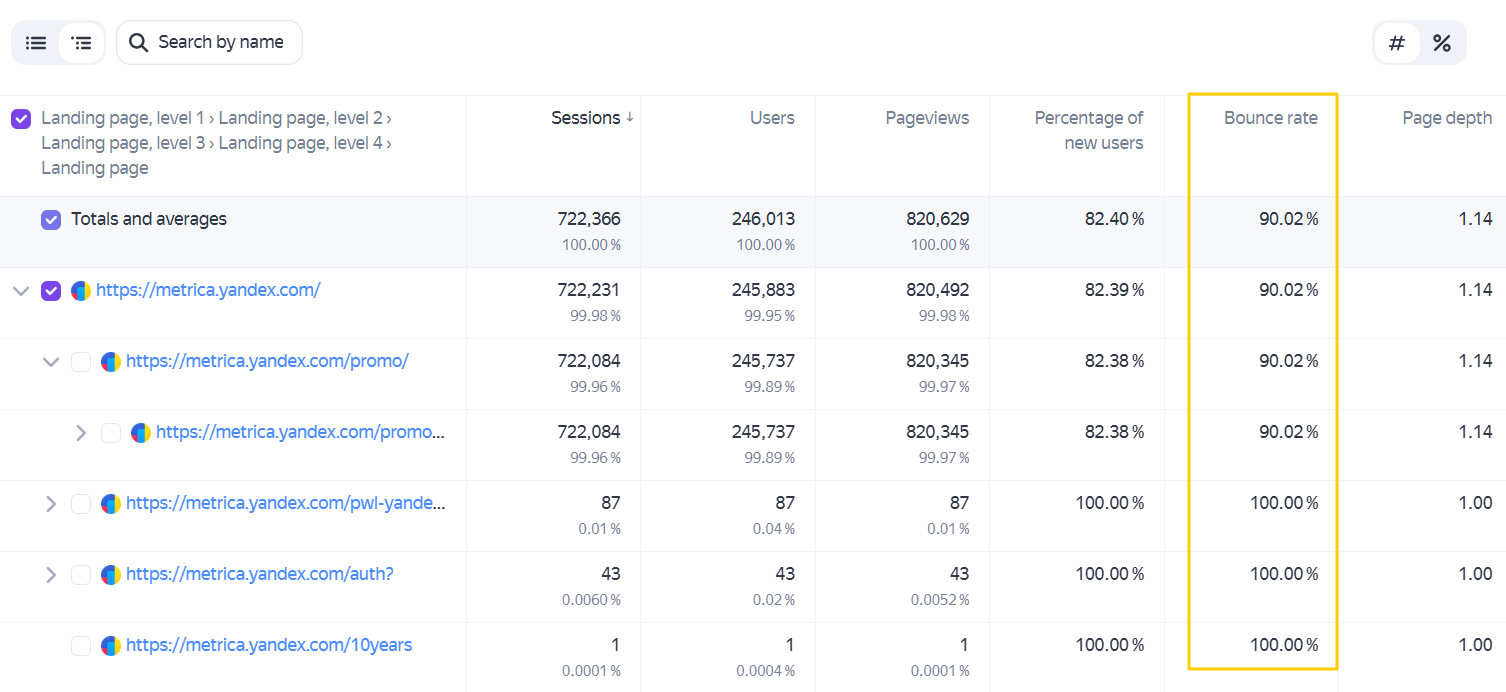
Determine user engagement
This can be done with the help of bounce. The higher the bounce rate, the lower user engagement (bounces indicate users who leave within 15 seconds of staying at a single page).
Learn which landing pages produce more converted users
To get this data, first create a goal and use it in your report.
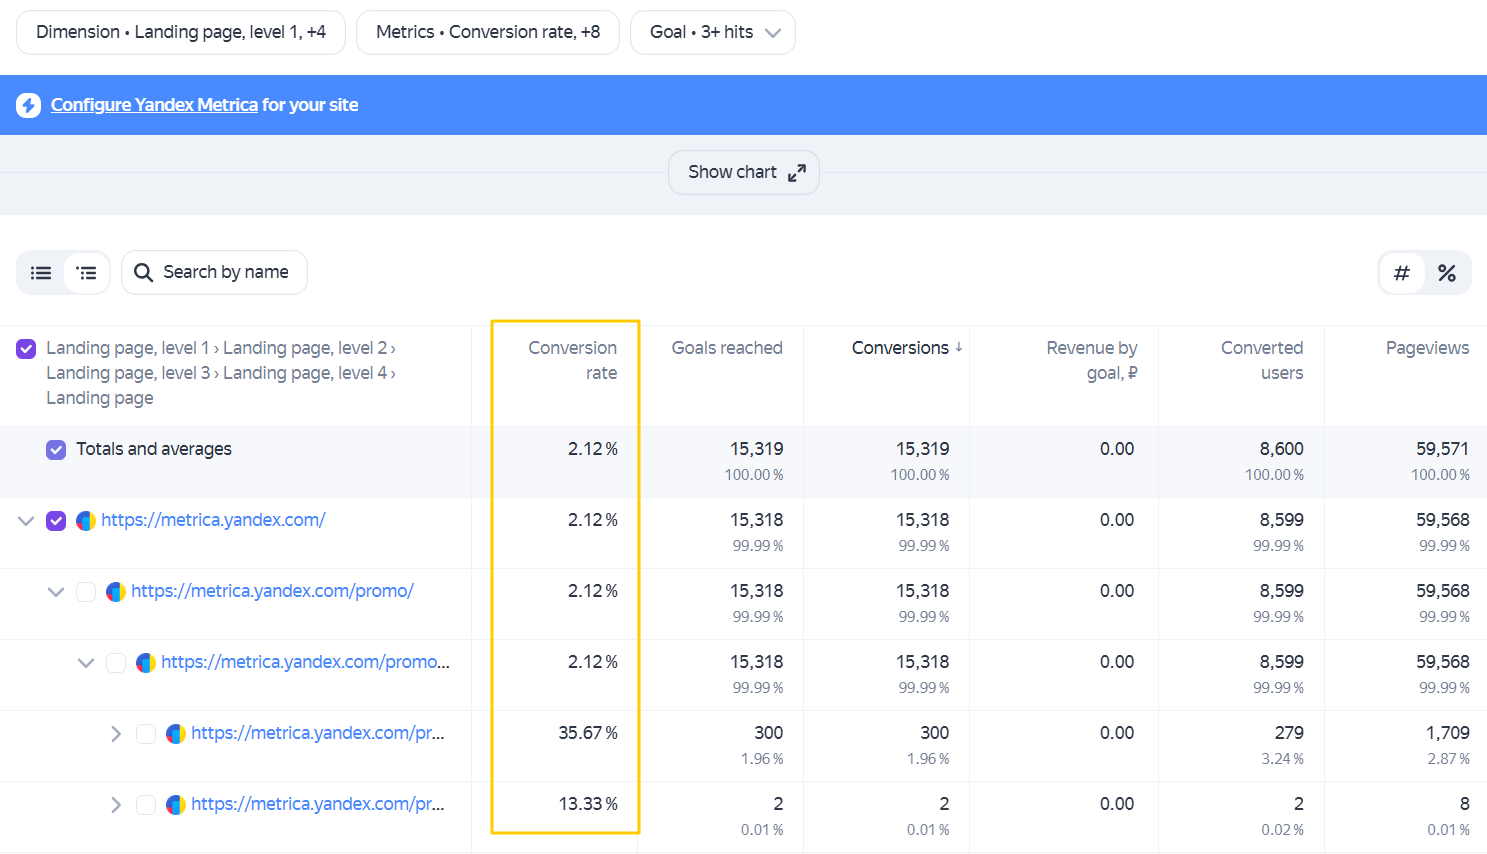
Determine the pages with the highest conversion rate
Conversion is one of the key metrics measured by Yandex Metrica.
You can view landing pages with the highest conversion rate.
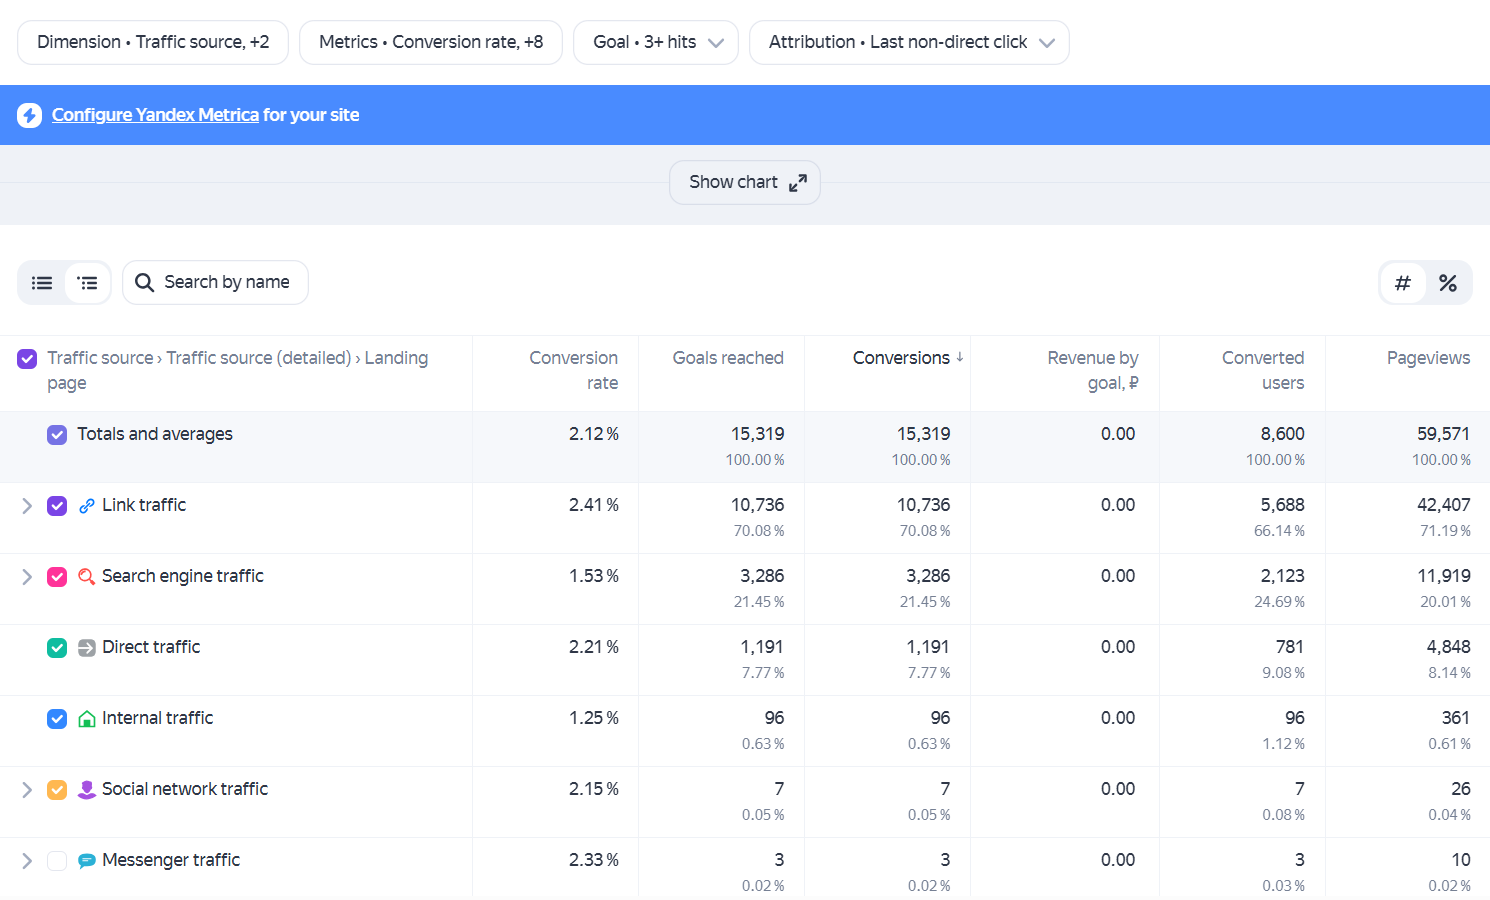
View the incoming traffic sources for specific pages
To do this, you need to change the report dimensions list:
- Click Dimension, select Traffic source and then choose Traffic source, details.
- Move the added dimensions to the top of the dimension list used in the report. Leave only the ones you need in the list to make it more manageable: Traffic source, Traffic source, details, and Landing pages.
- Choose list view.
Report structure and settings
The report supports all settings available in Yandex Metrica.
|
Useful links |
Online training |
The sequence of actions (activity) performed by a single user on the site (on a single tag). What is considered as user activity: pageviews, clicks on outbound links, file downloads, and triggers of the functions reachGoal, hit, params, extLink, file, notBounce.
The number of conversions as a percentage of the total number of sessions.