Scroll map
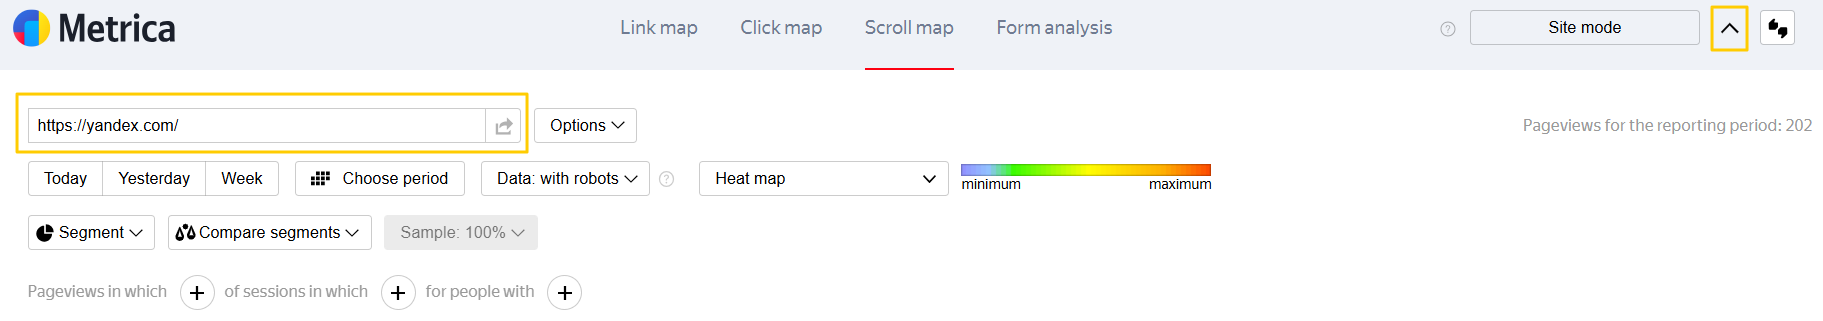
The scroll map is a tool for analyzing how site users pay attention to particular areas of website pages. The scroll map can help you select the best page length and optimally place important information.
It shows the average viewing time and number of views for a specific part of the page that you put the cursor on. You can also get statistics for a group of pages. For example, for a specific folder.
You can use multiple map display modes:
- Heat map: Changes to page viewing time are shown in color-coded zones.
- Transparency map: Areas of the page that the user spent less time viewing are darkened, while areas that were viewed longer are more transparent.
Minimum — The minimum viewing time out of the total time of pageviews of the selected page.
Maximum — The maximum viewing time out of the total number of pageviews of the selected page.
Note
-
Data is stored for 15 days, including the current day.
-
The map is only displayed on those pages of the site where the Yandex Metrica tag is installed, and also if the site uses UTF-8 encoding.
-
When building the map, elements such as
www, advertising tags, and the part of the link after#(inclusive) are excluded from the URL, but regular URL parameters are not excluded. This is why the click maps for the pageshttp://example.com?id=1andhttp://example.com?id=2will be different. -
Internet Explorer versions 8.0 and earlier are not supported.
Connecting
- In Yandex Metrica, go to Settings → Tag.
- Select the Session Replay, scroll map, form analysis option.
- Save the changes.
- Install the updated tag code on all the site’s pages.
Note
The map may be disabled if it hasn’t been viewed in the past six months. To resume session recording, enable the option again.
Statistics on a group of pages
To view statistics for a group of pages, you can use extra characters in the URL box.
Characters used for displaying statistics
|
Character |
Description |
Example |
|
* |
Matches any number of any characters |
Display data for all pages with URLs that start with https://example.com/goods/, including the specified page: If you enter the address without extra characters, Metrica will offer a drop-down suggestion with the * character |
|
~ |
The condition is a regular expression |
Show data for pages with a URL matching a regular expression. For example: |
Let’s look at an example. You need to get statistics on pages in the directory https://example.com/goods/. In order for this data to be shown on the map, enter https://example.com/goods/* in the address box (after you enter it, the same address is shown in the drop-down suggestion). Data is loaded automatically.
The map will be displayed on the most popular page with a URL that matches what you specified. Numerical indicators (the average session length and number of sessions) will be combined for all the pages that match the condition.
Showing data in an iframe
If your site is protected from being shown in an iframe (the X-Frame-Options header is used in the server settings), you won't be able to view the collected data. To view the site’s session data, use a regular expression in the server settings to add exceptions for the following domains:
- your website
- metrika.yandex.ru
- metrika.yandex.by
- metrica.yandex.com
- metrica.yandex.com.tr
- webvisor.com and its subdomains
^https?:\/\/([^\/]+\.)?(yourdomain\.com|webvisor\.com|metri[ck]a\.yandex\.(com|ru|by|com\.tr))\/
If you use nginx, add the following exceptions to your configuration:
location / {
        set $frame_options '';
        if ($http_referer !~ '^https?:\/\/([^\/]+\.)?(yourdomain\.com|webvisor\.com|metri[ck]a\.yandex\.(com|ru|by|com\.tr))\/'){
            set $frame_options 'SAMEORIGIN';
        }
        add_header X-Frame-Options $frame_options;
        ...
    }
where yourdomain\.com is the site's domain name. Use your site’s domain zone (it may differ from .com).
Page size restriction
In order to display data on the map, the website pages must meet certain size restrictions. The values below are for displaying the map in various browsers:
|
Browser |
Maximum page height/width (in pixels) |
Maximum number of pixels |
|
Mozilla Firefox |
32,767 |
472,907,776 (22,528 x 20,992) |
|
Chrome |
32,767 |
268,435,456 (16,384 x 16,384) |
|
Internet Explorer |
8,192 |
67,108,864 (8,192 x 8,192) |
Questions and answers
Click map, link map or scroll map page loads endlessly
In Safari 12 and higher, the click map, link map, or scroll map page may never finish loading due to an option in the browser settings.
- Go to the Privacy tab and disable the Prevent cross-site tracking option.
- Restart the browser and open the maps again.
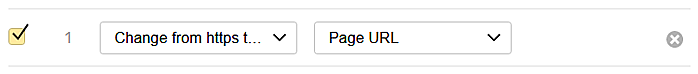
When a request is made, a “No data” notification appears in the map
This can happen if in the tag settings on the tab Filters the action Change from https to http is enabled. In this case, all URLs with HTTP protocols are on the map, and the site itself has the HTTPS protocol.
To start displaying the data, disable the operation.
|
Useful links |
Online training |
Loading one of a site’s pages when a user navigates to it. Pageviews also include page refreshes, AJAX site updates, and sending data using the hit method.