Examples of how to set road levels at interchanges
- Illustrates how road sections are divided up and how levels A and B are set at a multi-level interchange (see Section 3.3.2.5. Level (A) and Level (B)) based on the example of a cloverleaf exchange (at the intersection of the M-4 and R-140 highways).
- Illustrates how road sections are divided up and how levels A and B are set at a multi-level interchange (in the Antwerp metropolitan area).
Example 1
Illustrates how road sections are divided up and how levels A and B are set at a multi-level interchange (see Section 3.3.2.5. Level (A) and Level (B)) based on the example of a cloverleaf interchange (at the intersection of the M-4 and R-140 highways); the figures show the successive stages of how levels A and B are set along highways and at interchange ramps.
Figure 1. Photo of the interchange with a map of the road network
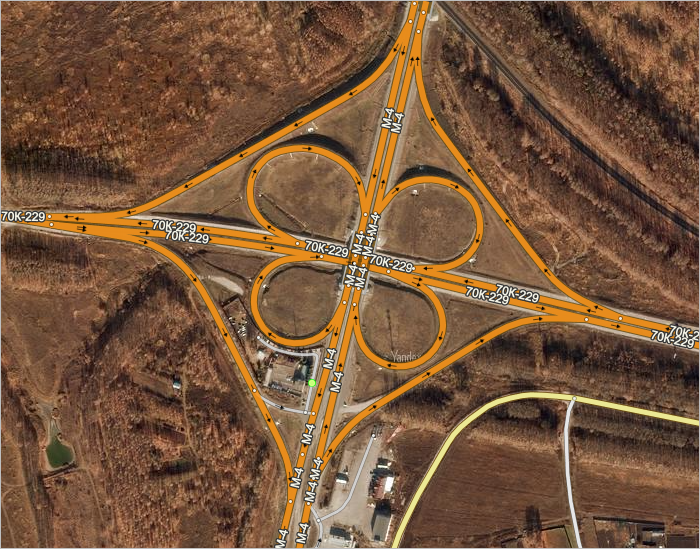
Figure 2. Road network map. The arrows show the traffic direction and the drawing direction (A → B) ; the green lines indicate the bridge abutment where the M-4 highway intersects with the P-140
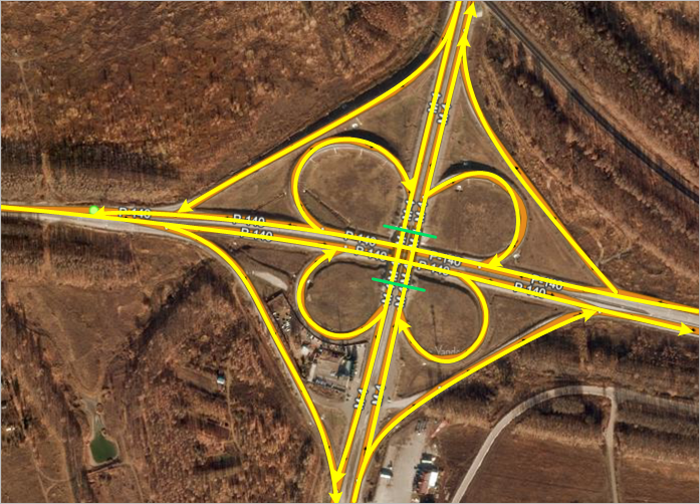
Figure 3. Mapping levels A and B of P-140 highway sections (the brown circles represent road intersections); all levels equal zero
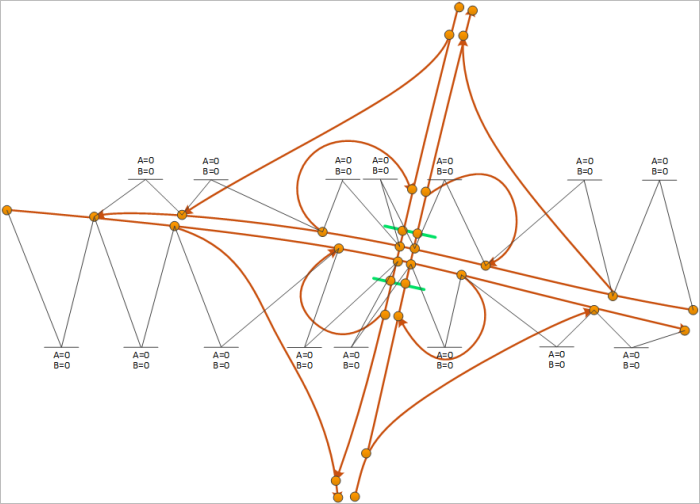
Figure 4. Mapping levels A and B of P-140 and M-4 exit ramps (the brown circles represent road intersections); all levels equal zero
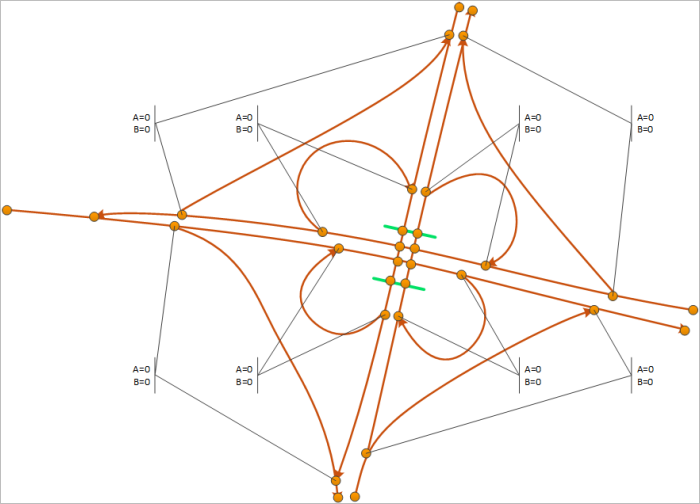
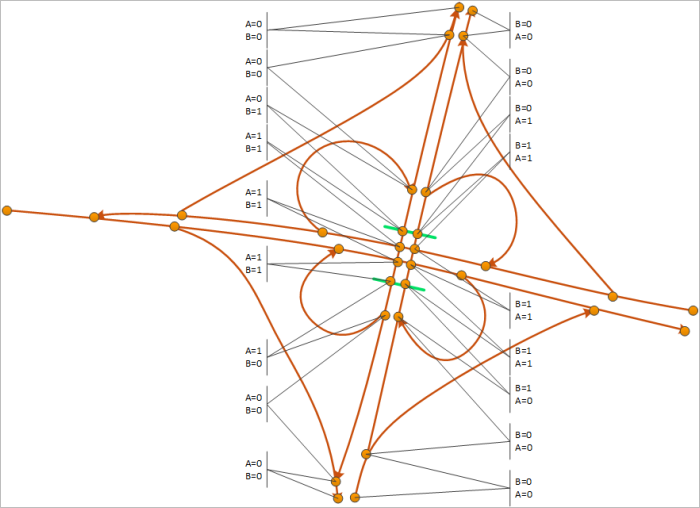
Figure 5. Mapping levels A and B of M-4 highway sections (the brown circles represent road intersections). Note that now the values of levels A and B have gone from zero to one as the highway passes over the bridge.
Example 2
Illustrates how road sections are divided up and how levels A and B are set at a multi-level interchange (see Section 3.3.2.5. Level (A) and Level (B)) based on the example of a multi-level interchange (in a suburb of Antwerp); the figures show the successive stages of how levels A and B are set along road sections.
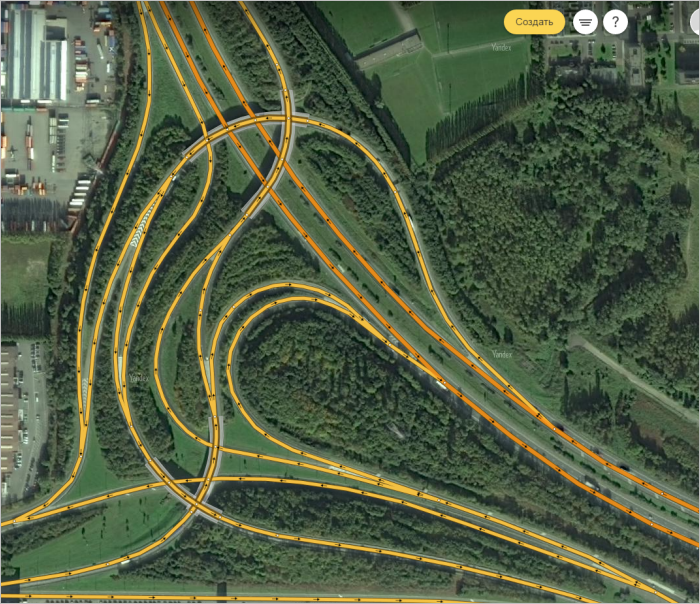
Figure 6. Interchange photograph
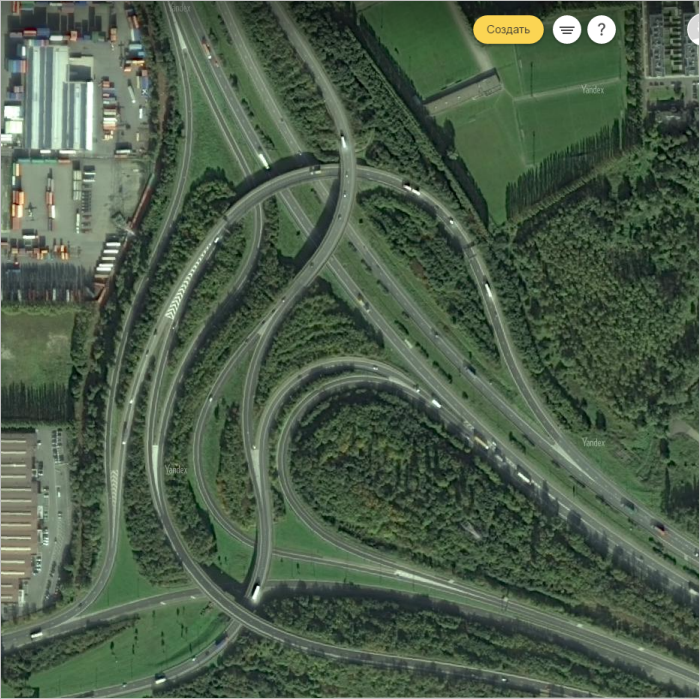
Figure 7. Road network map. The small brown circles depict road intersections (the circles at the edges of the drawing do not correspond to actual intersections in the road network, they are just there to define the scope of the diagram). Arrows correspond to road sections. The arrows indicate the traffic direction and the drawing direction (A → B). The green lines indicate the road sections that pass over bridges and overpasses
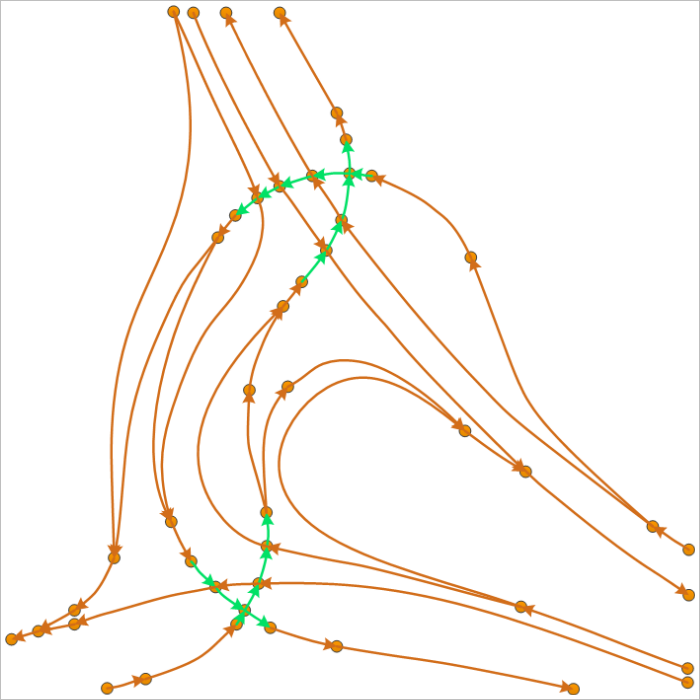
Figure 8. Mapping levels A and B of regional roads (in blue). All levels equal zero
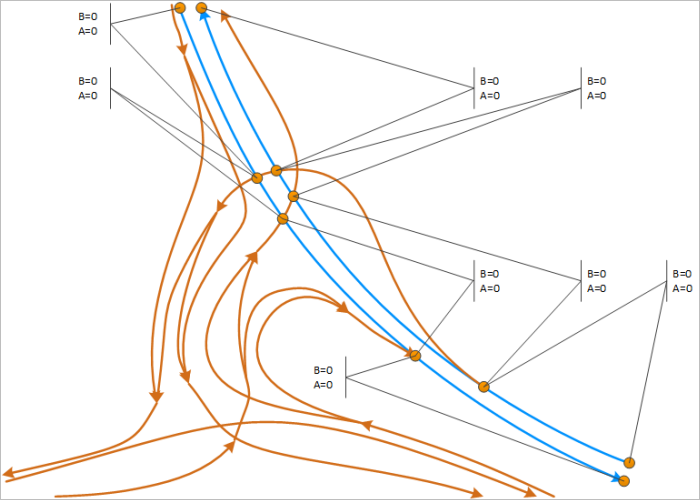
Figure 9. Mapping levels A and B of district roads (in green). All levels equal zero
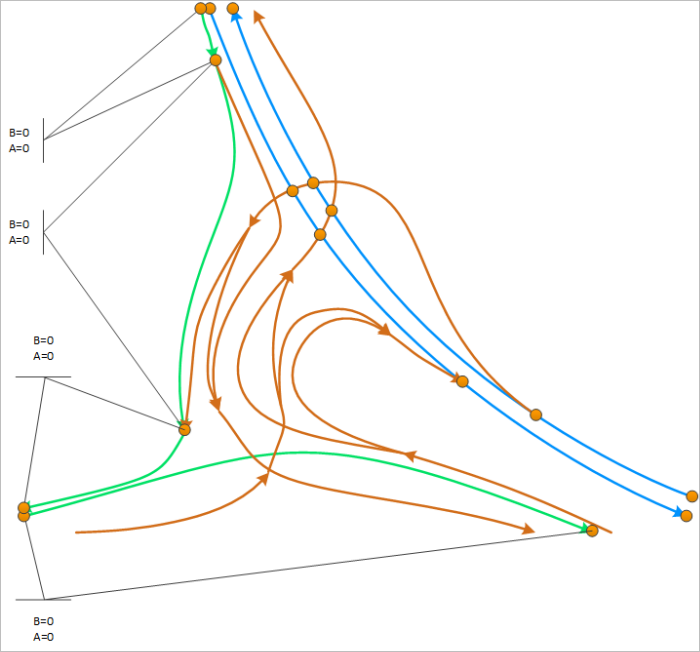
Figure 10. Mapping levels A and B for several exit ramps (dark blue). Note that the values of level A and B change over the bridges and overpasses
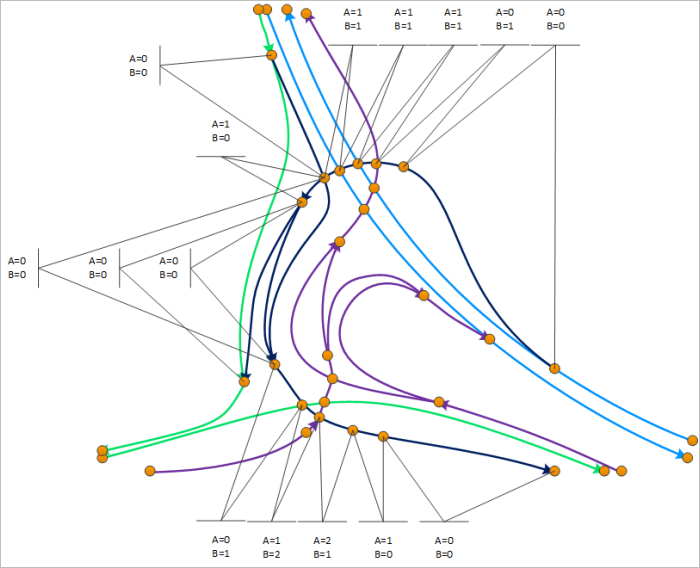
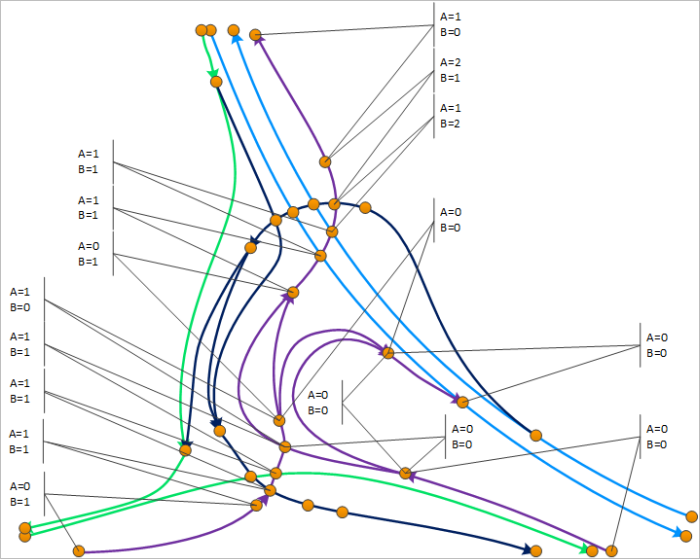
Figure 11. Mapping levels A and B for several exit ramps (purple). Note that the values of level A and B change over the bridges and overpasses
Picture 12. Photo of the interchange showing the road network map and infrastructure