Build a dashboard with AppMetrica: just the metrics you actually need
The journey to perfection is an endless pursuit. Unfortunately, none of the analytics systems currently available is truly universal. With this in mind, we would like to offer some tools that will help you get information tailored to the needs of your team.
What the AppMetrica APIs can offer
Our APIs allow you to get both aggregated and raw data from AppMetrica. This means that you can use the data to design a custom dashboard or create your own analytics solution. AppMetrica will use the SDK to collect data and store it indefinitely.
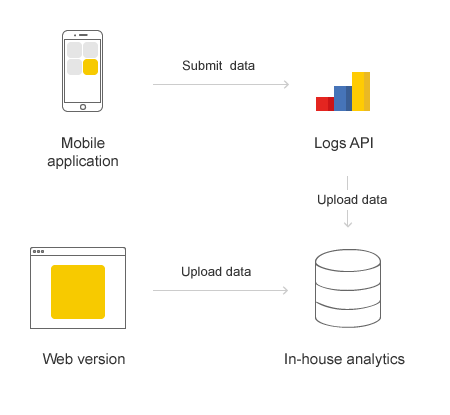
Our users already access the API to download advertising identifiers for retargeting campaigns. They link usernames to these identifiers to combine statistics from a mobile app with data from a web service. We described how to combine AppMetrica data with in-house analytics in our post about the Logs API.
In most cases, the necessary statistics are derived from numbers that have already been calculated by AppMetrica. But if you choose to aggregate data in-house, you can build your own metrics in addition to the standard ones.
We have examples of both of these approaches that we’ll discuss below.
The Reporting API and real-time analytics from Atlas
You can use the Reporting API to get any data that is available in the AppMetrica interface and display it in your system however you want. If you need metrics that our service doesn’t provide yet, you can calculate them from the existing metrics.
That’s exactly what the developers at the mobile service provider this0link did.
How the Atlas dashboard works
The dashboard tracks metrics in real time. Atlas uses the accumulated data to evaluate user interest in the app, the path through the conversion funnel, and the ROI for each channel.
The chart of user sign-ups is shown at the very top as one of the main growth indicators. The upper-right corner shows conversions for the most valued action in terms of monetization — purchasing products and getting cash back. The metrics are dynamically updated if you choose a different partner or time period, so it only takes a couple of clicks to assess the conversion rate for a traffic source.
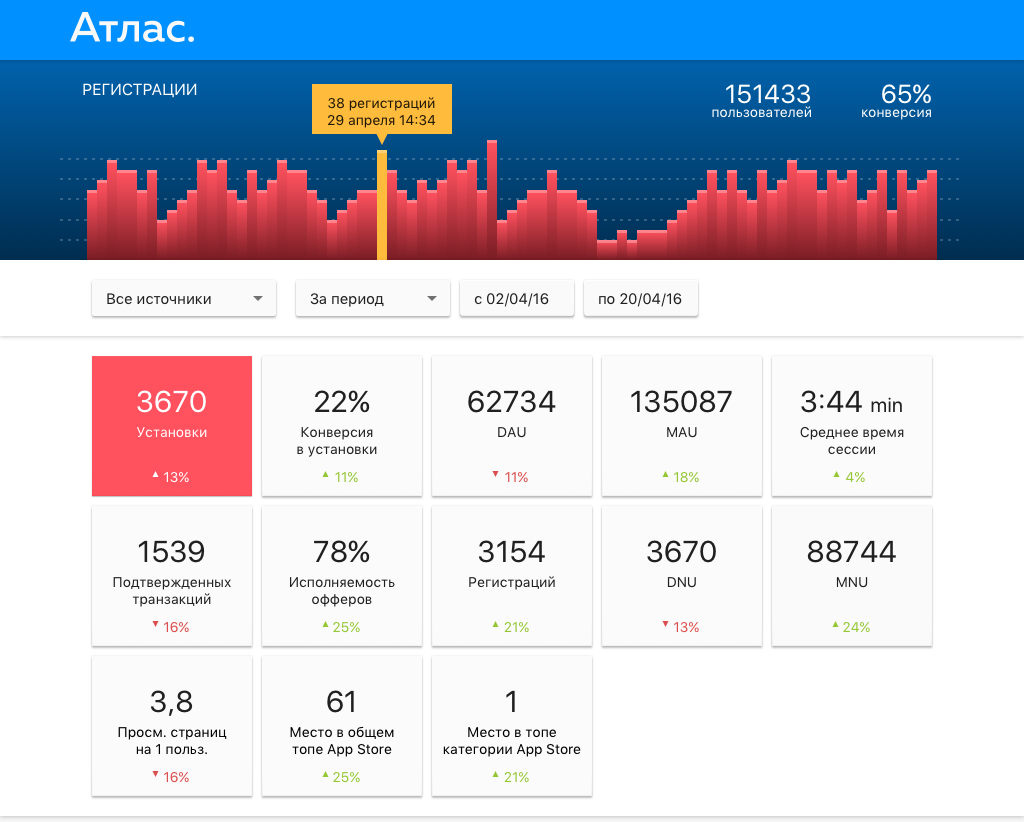
Key statistics for the time period and the install source are shown below the chart. When adding a new source, you can always catch dips in metrics for events typical of non-targeted traffic. This means you can stop an ad campaign early on, analyze the logs in detail, and decide whether to continue working with this partner.
Further down you can track the dynamics of installs and events, which helps catch incent traffic. The data is shown in real time, which allows you to detect fraud immediately.
The very bottom of the dashboard shows a table of income from each traffic source. This table is very valuable, since it sets the standard ROI for each marketing channel. This is the information that is ultimately used for making decisions about continuing or ending partnerships.
The Atlas team is continuing the dashboard development and plans to add new features:
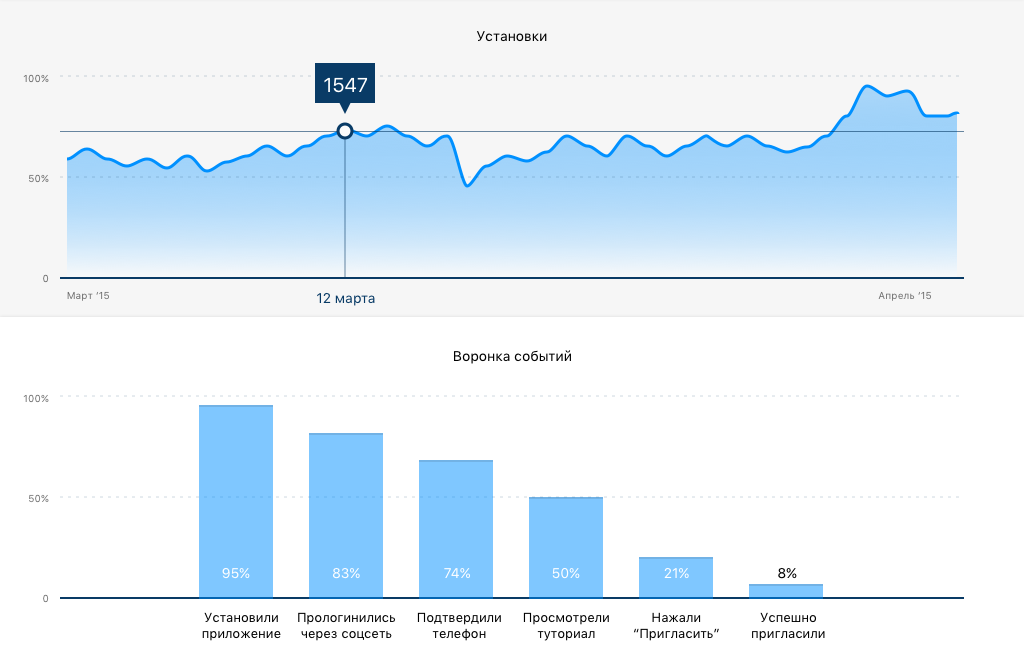
- Breaking down metrics by the hour and the minute in order to detect unusual instances of fraud.
- Breaking down ROI metrics not just by channel, but by sub_id and even by the creative used. Highly detailed segmentation makes it possible to choose the most effective advertising materials.
So how can I do the same thing?
You will need to use the Reporting API for your dashboard to get data from AppMetrica. There are many different ways to display the information. It is up to you to decide what works best for your needs — you can even use Microsoft Excel for very basic tasks.
Aggregating AppMetrica data on the client side. How BlackBears Analytics does it
We’ve already written about how to use AppMetrica to get your app’s revenue data, and manual calculations are fine at a certain stage. But when you need to analyze revenue in multiple segments, a custom dashboard does the job better.
For this purpose, the team at BlackBears Games created BlackBears Analytics using the AppMetrica Logs API and the ClickHouse DBMS.
How BlackBears Analytics works
The system is available in the public domain, and anyone can implement it on their own server. The analytics system downloads the necessary event data from AppMetrica once a day using the Logs API. The dashboard aggregates this data and displays the following metrics:
- Number of app installs
- ARPU and ARPPU
- Income from confirmed purchases
- Advertising revenue
- Average bill (amount spent per user)
The screenshot shows the BlackBears Analytics dashboard for one of their apps. All the metrics are visible on the same screen and they update dynamically if you change the date or add new partners. You can analyze the overall totals or look at separate numbers for each advertising platform.


